I am Camille.
@fulgenteft
These slides are here: camilleanne.github.io/intro_to_neogeography
Geography for Web Maps
The Good, The Bad, and the Stuff You Can Forget
aka,
Intro to Neogeography
I make stuff at @mapbox
We make software and tools for people to make beautiful custom maps for web + mobile
I teach people about maps @maptimesf
github.com/maptime + maptime.io

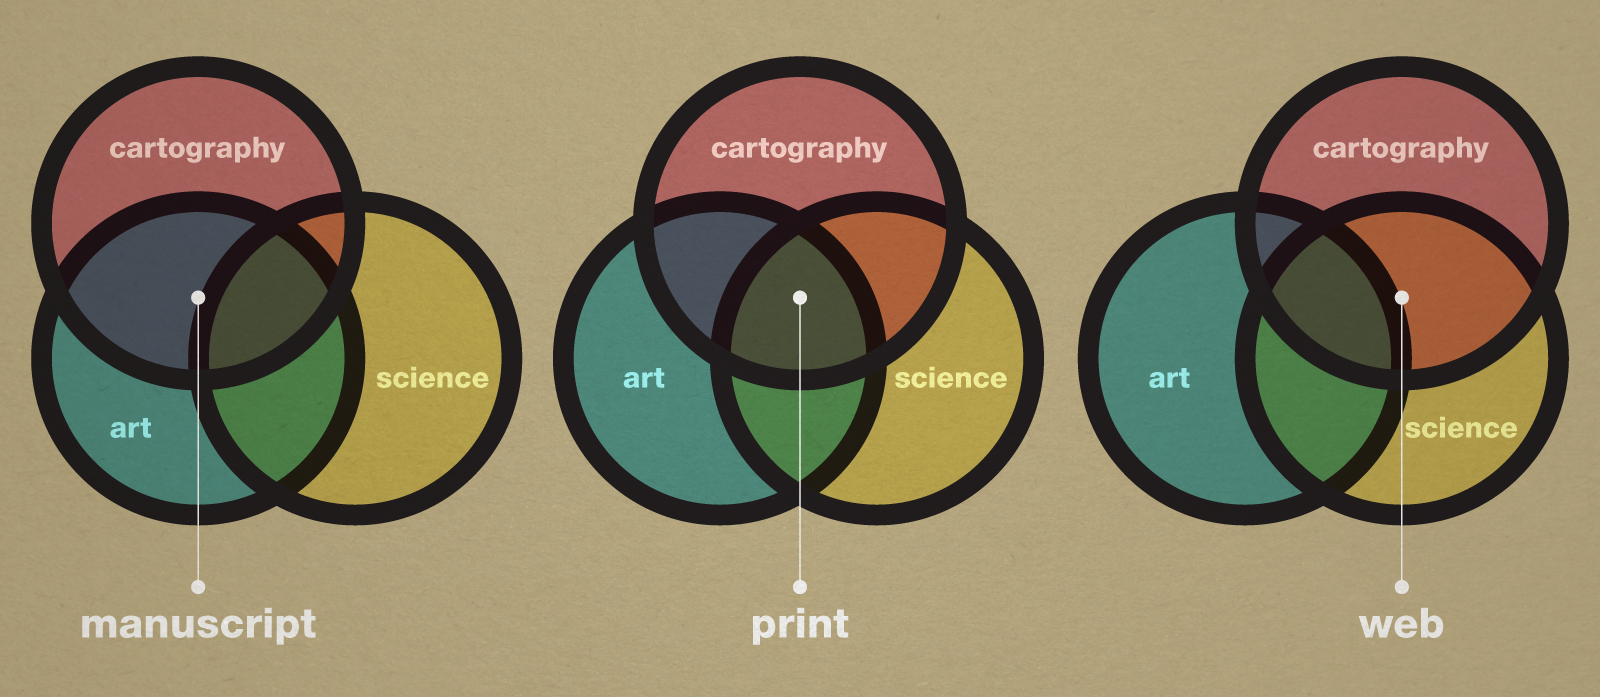
why?
Representation is important
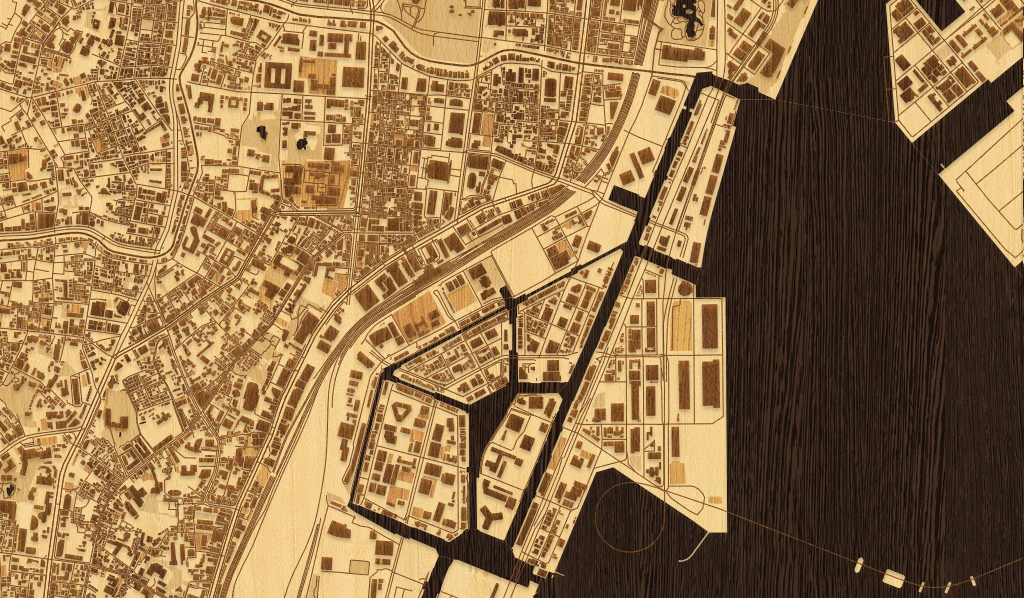
Aesthetics
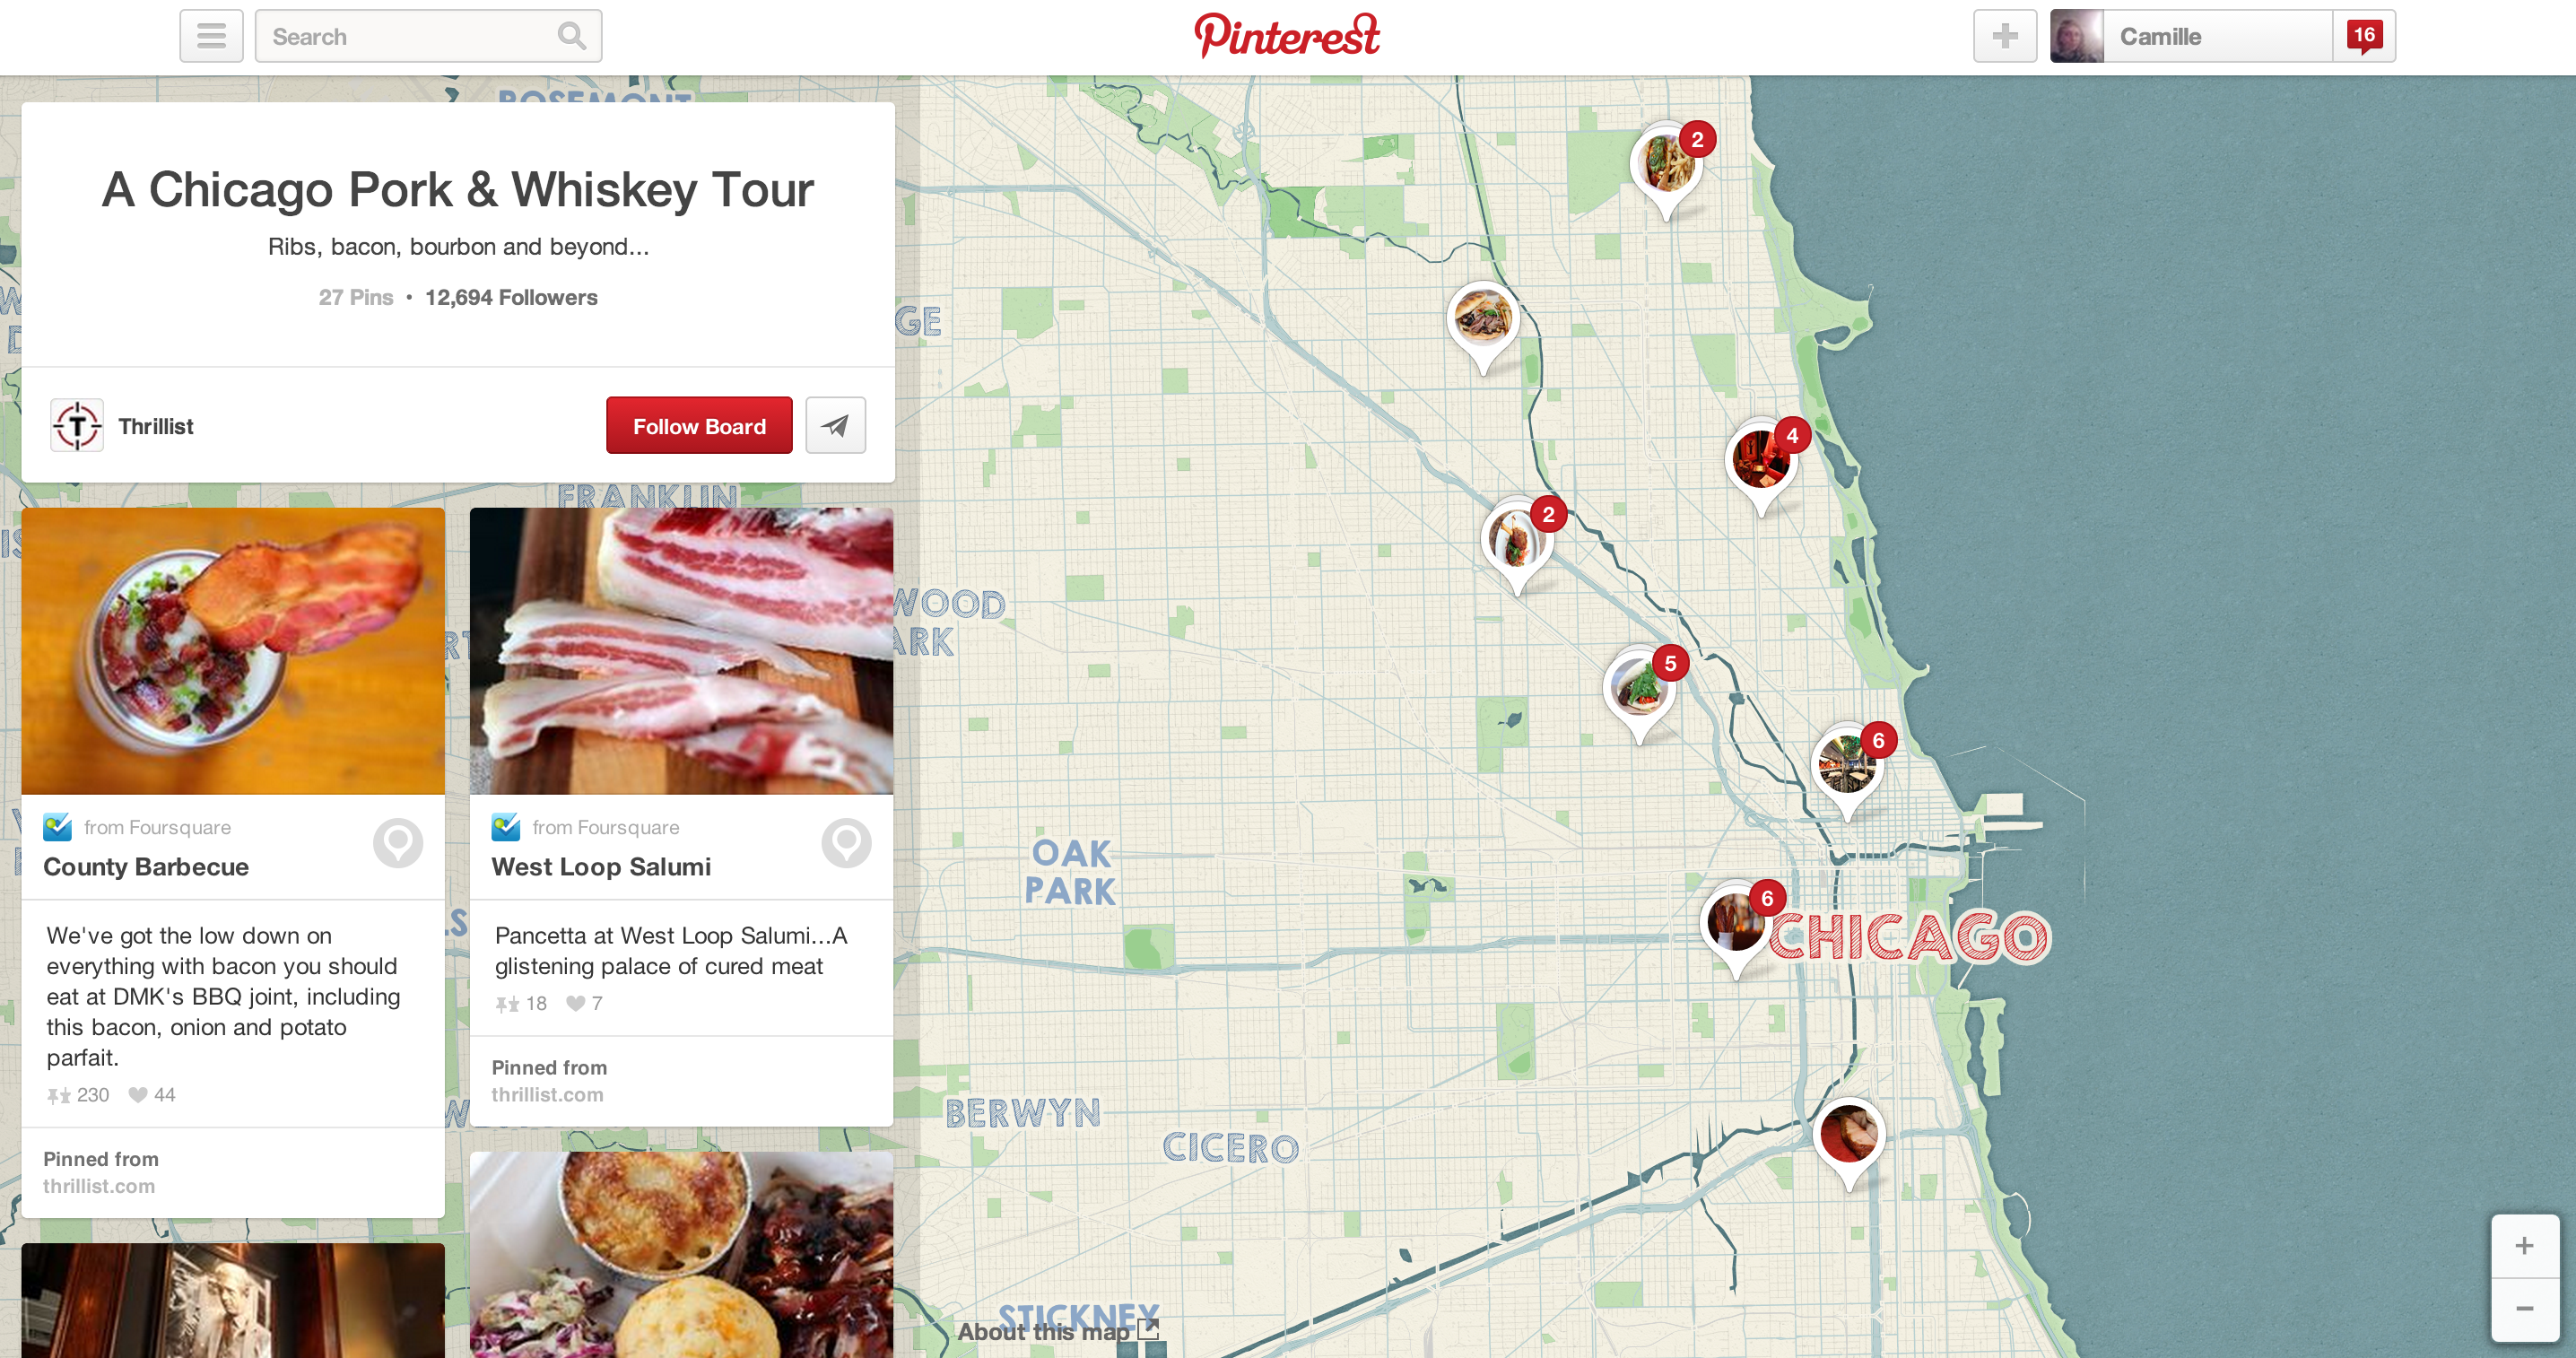
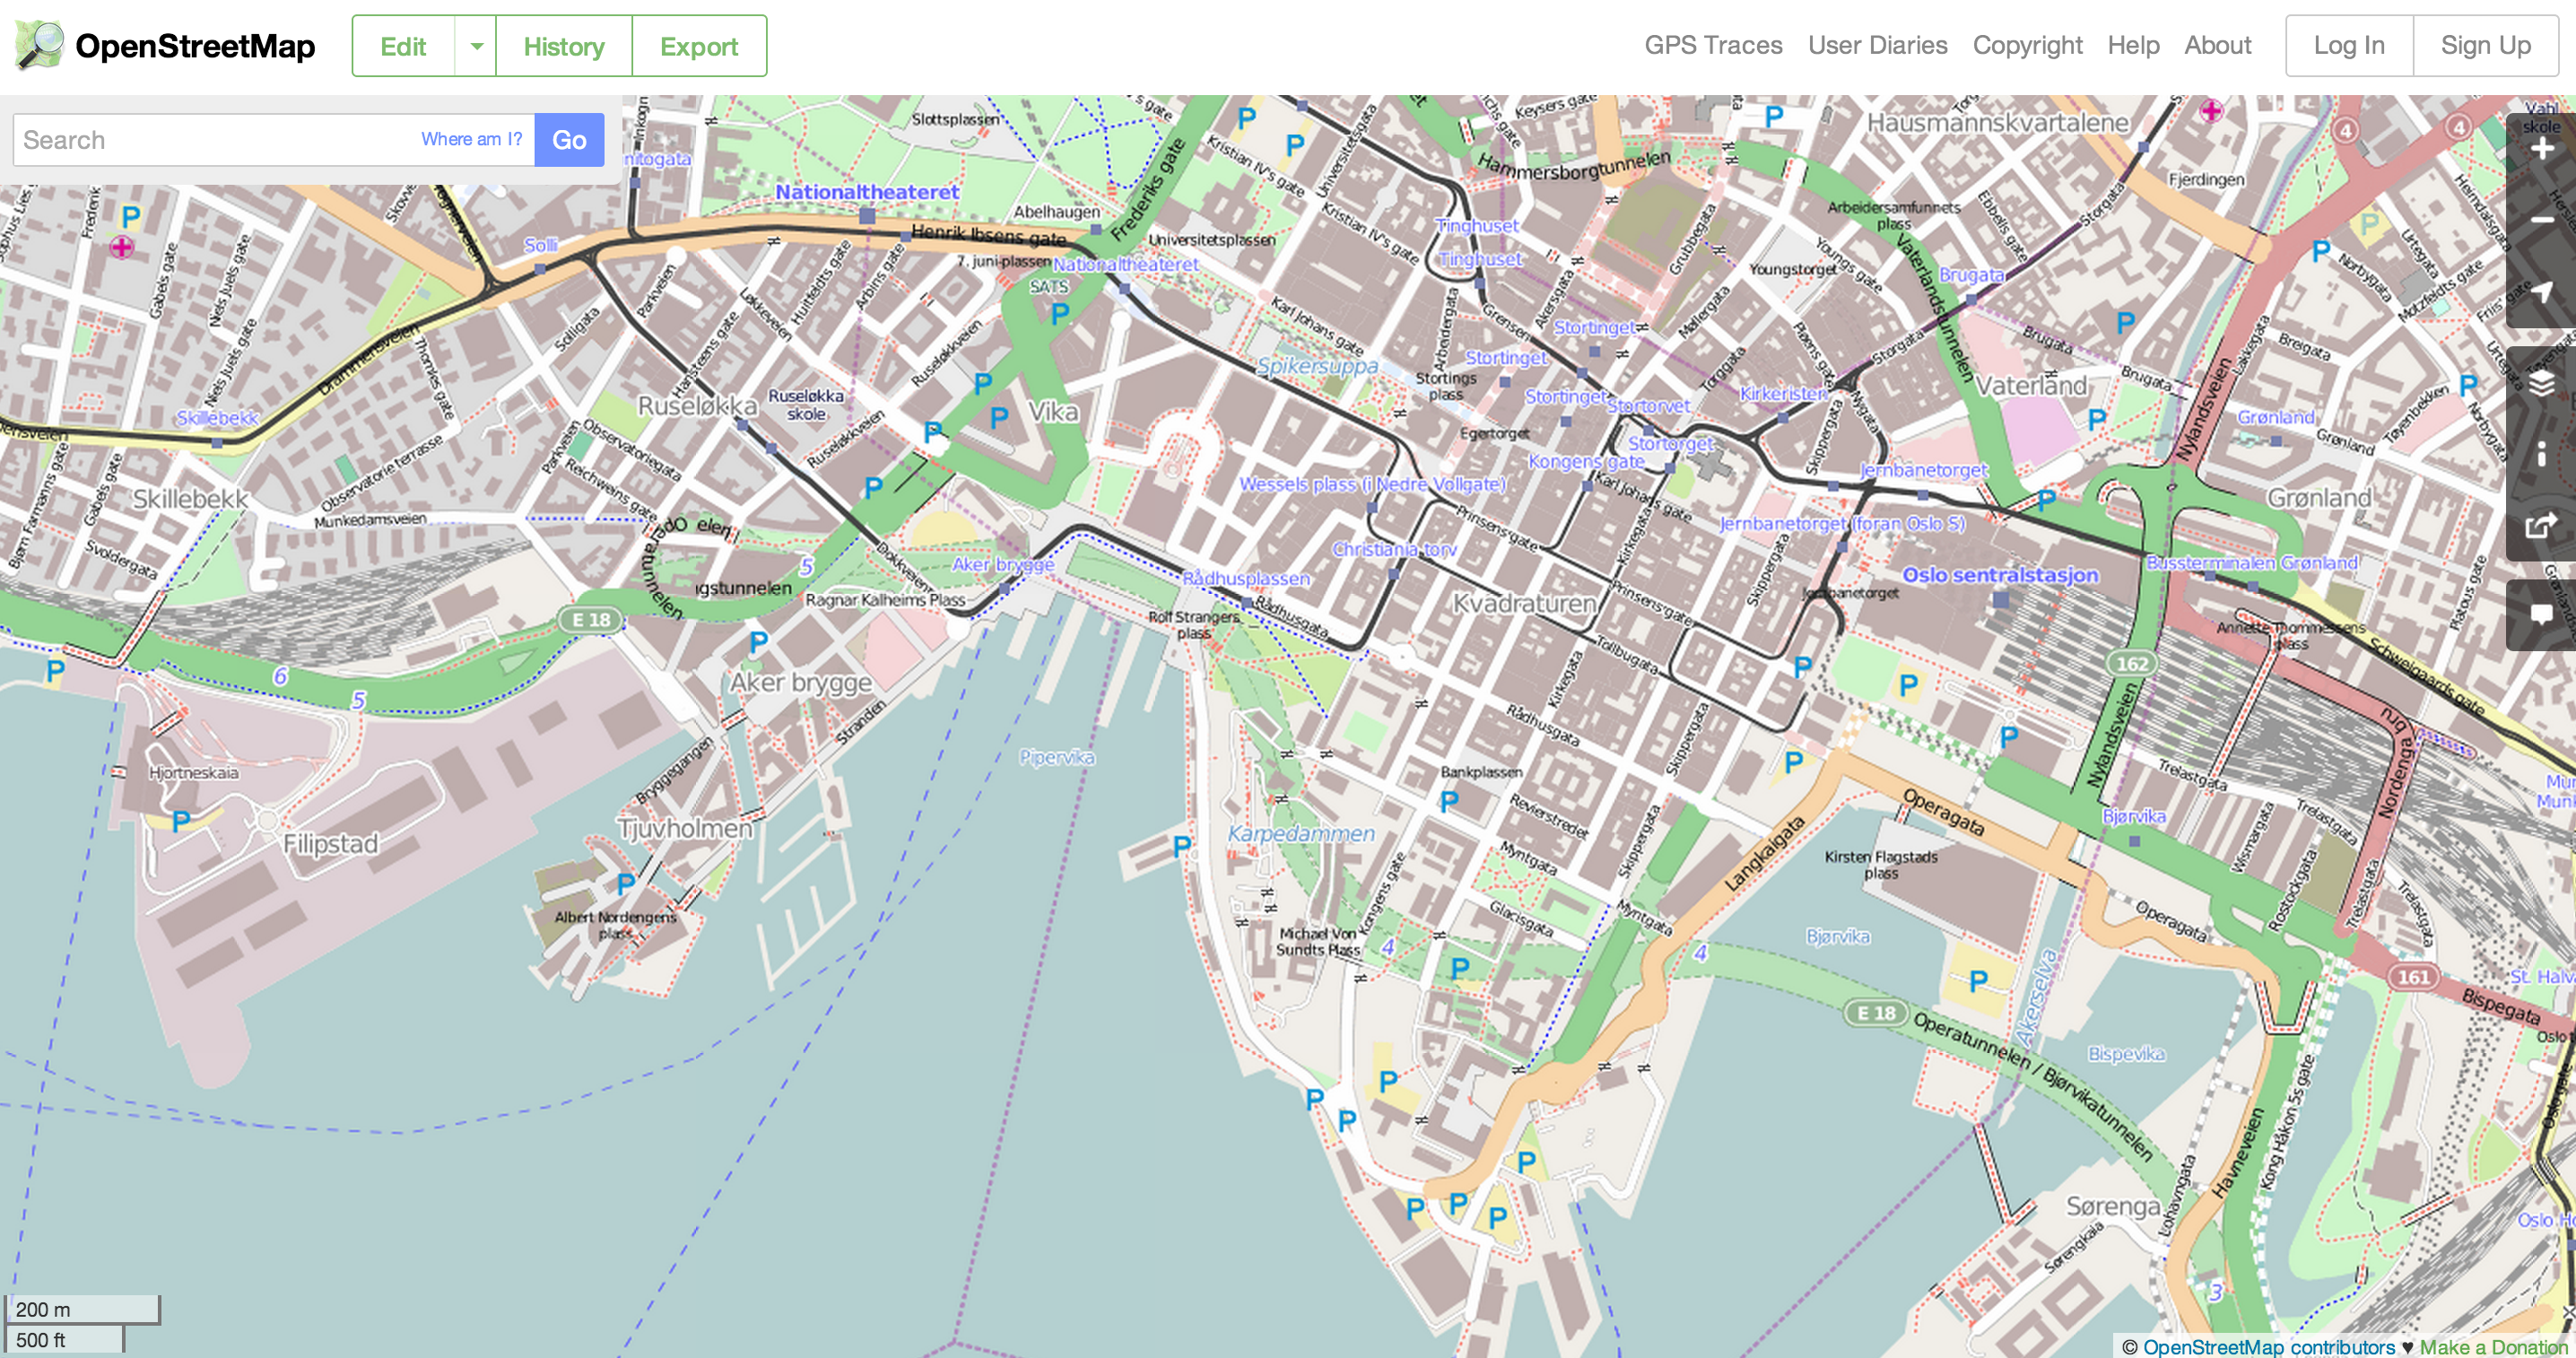
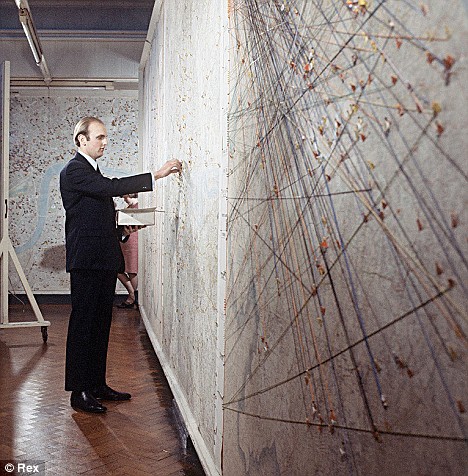
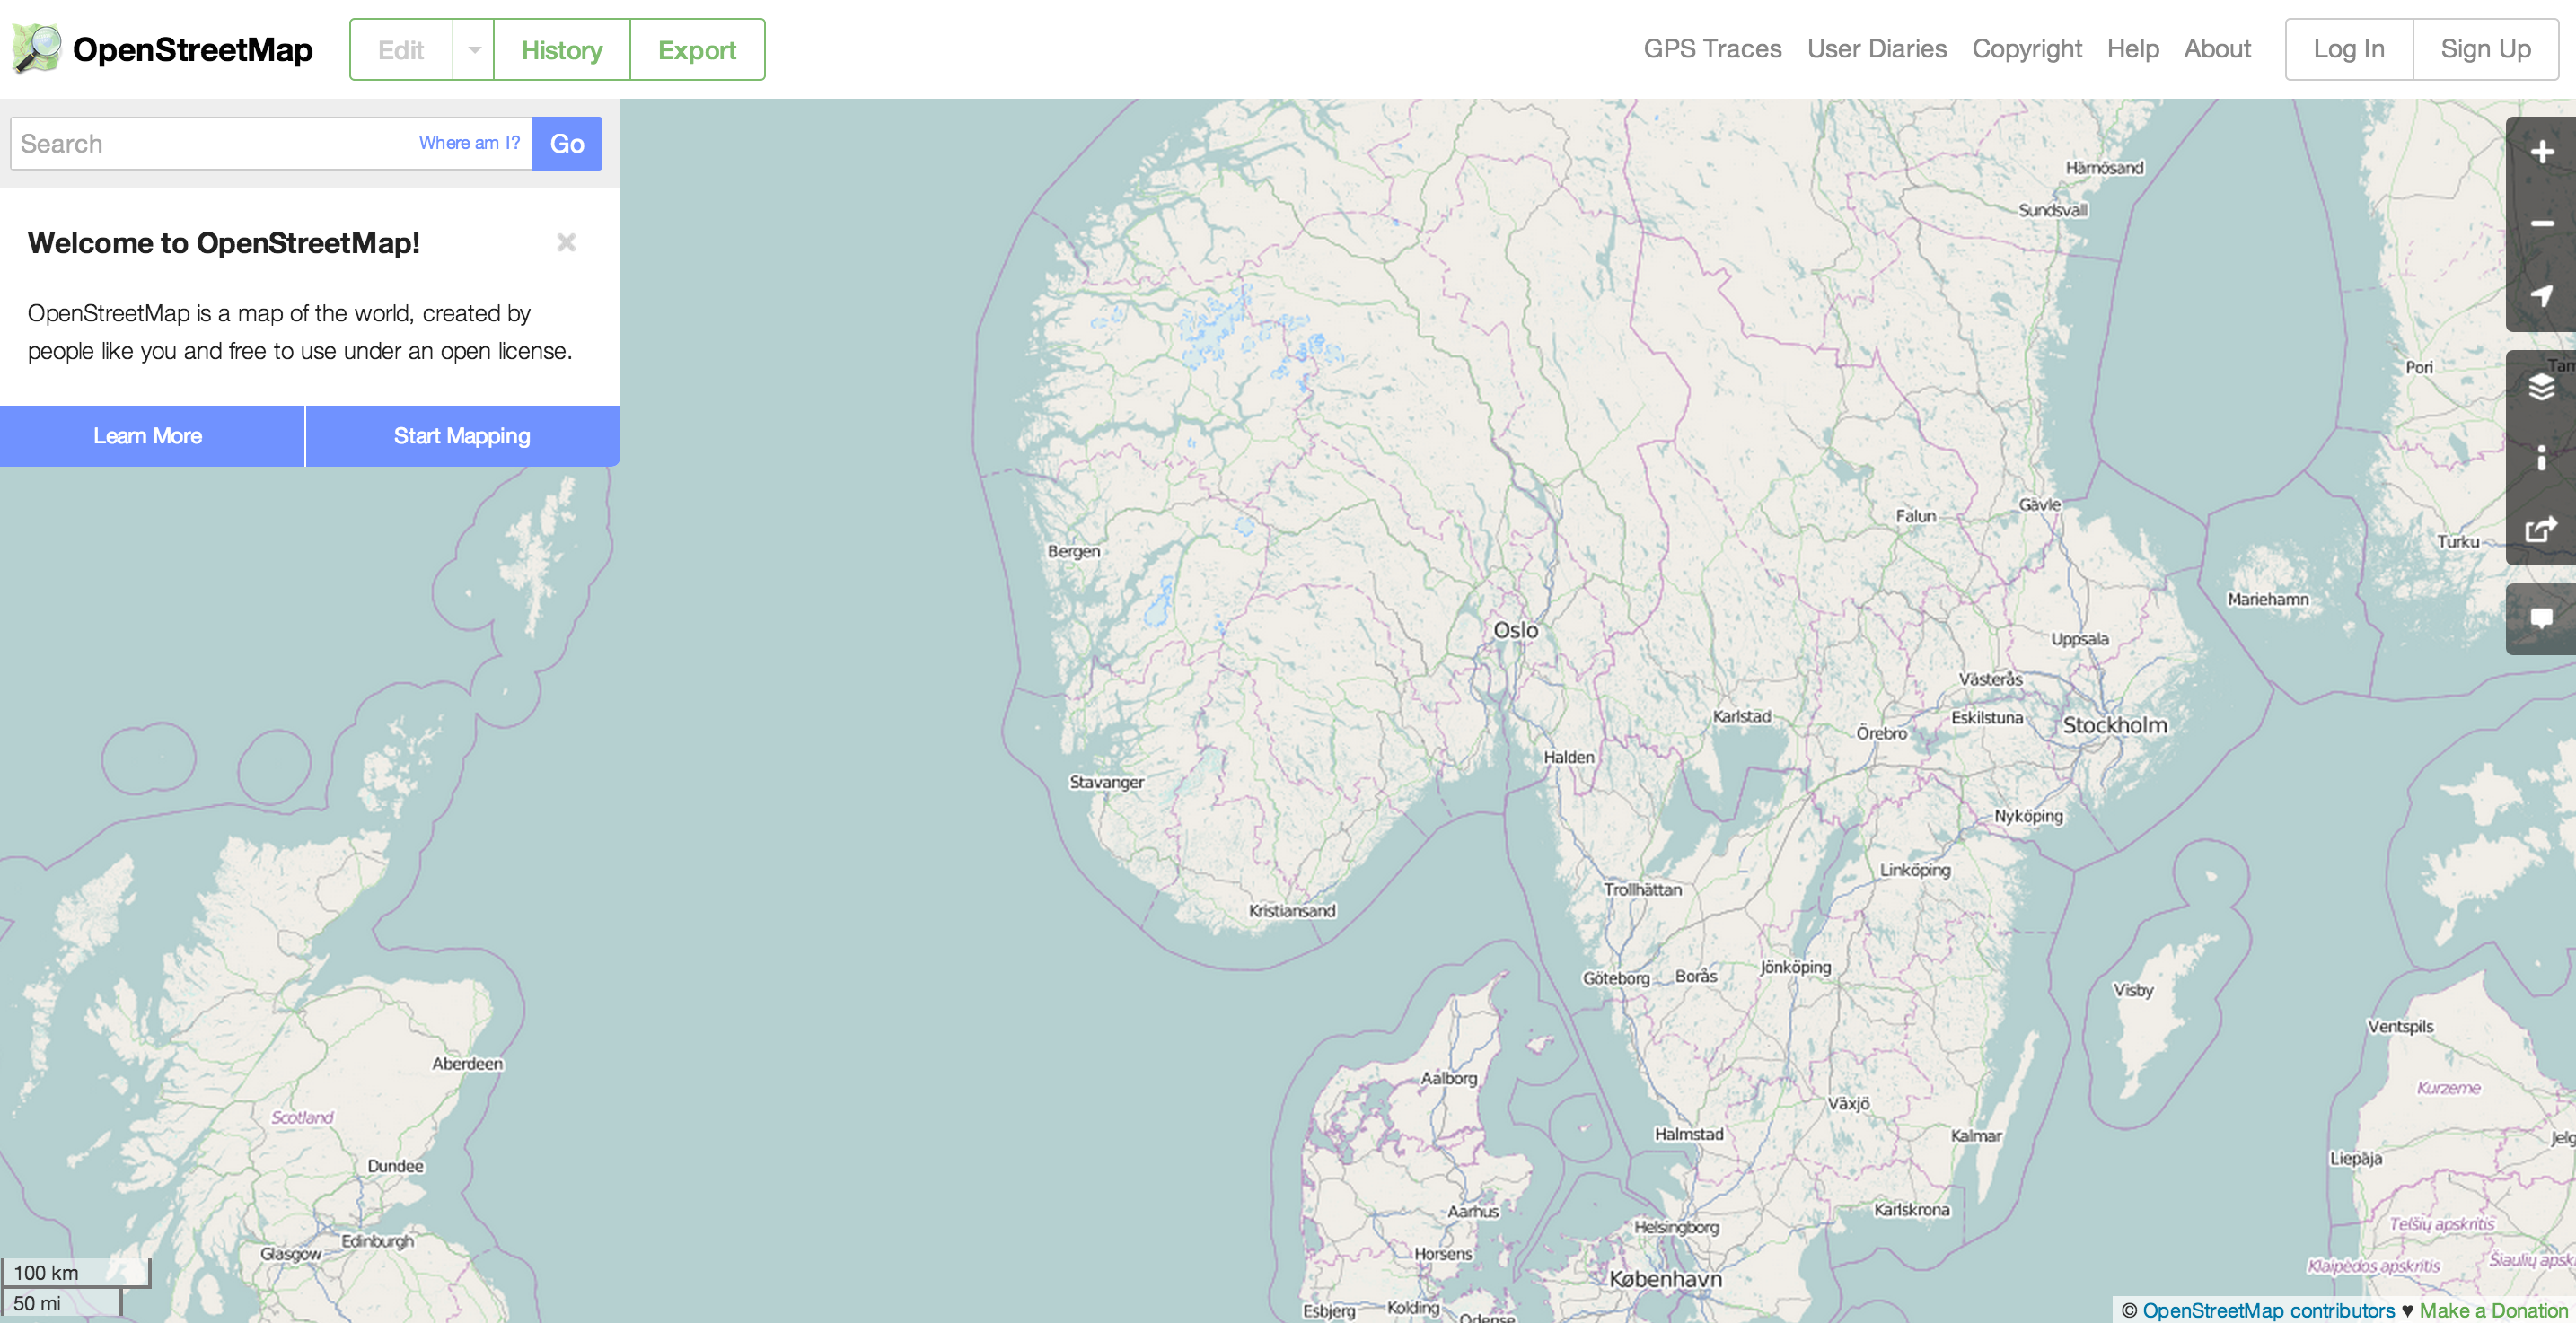 Open Street Map
I am going to teach you all how to be neogeographers
- geodata
- what to do with the data
- tools!
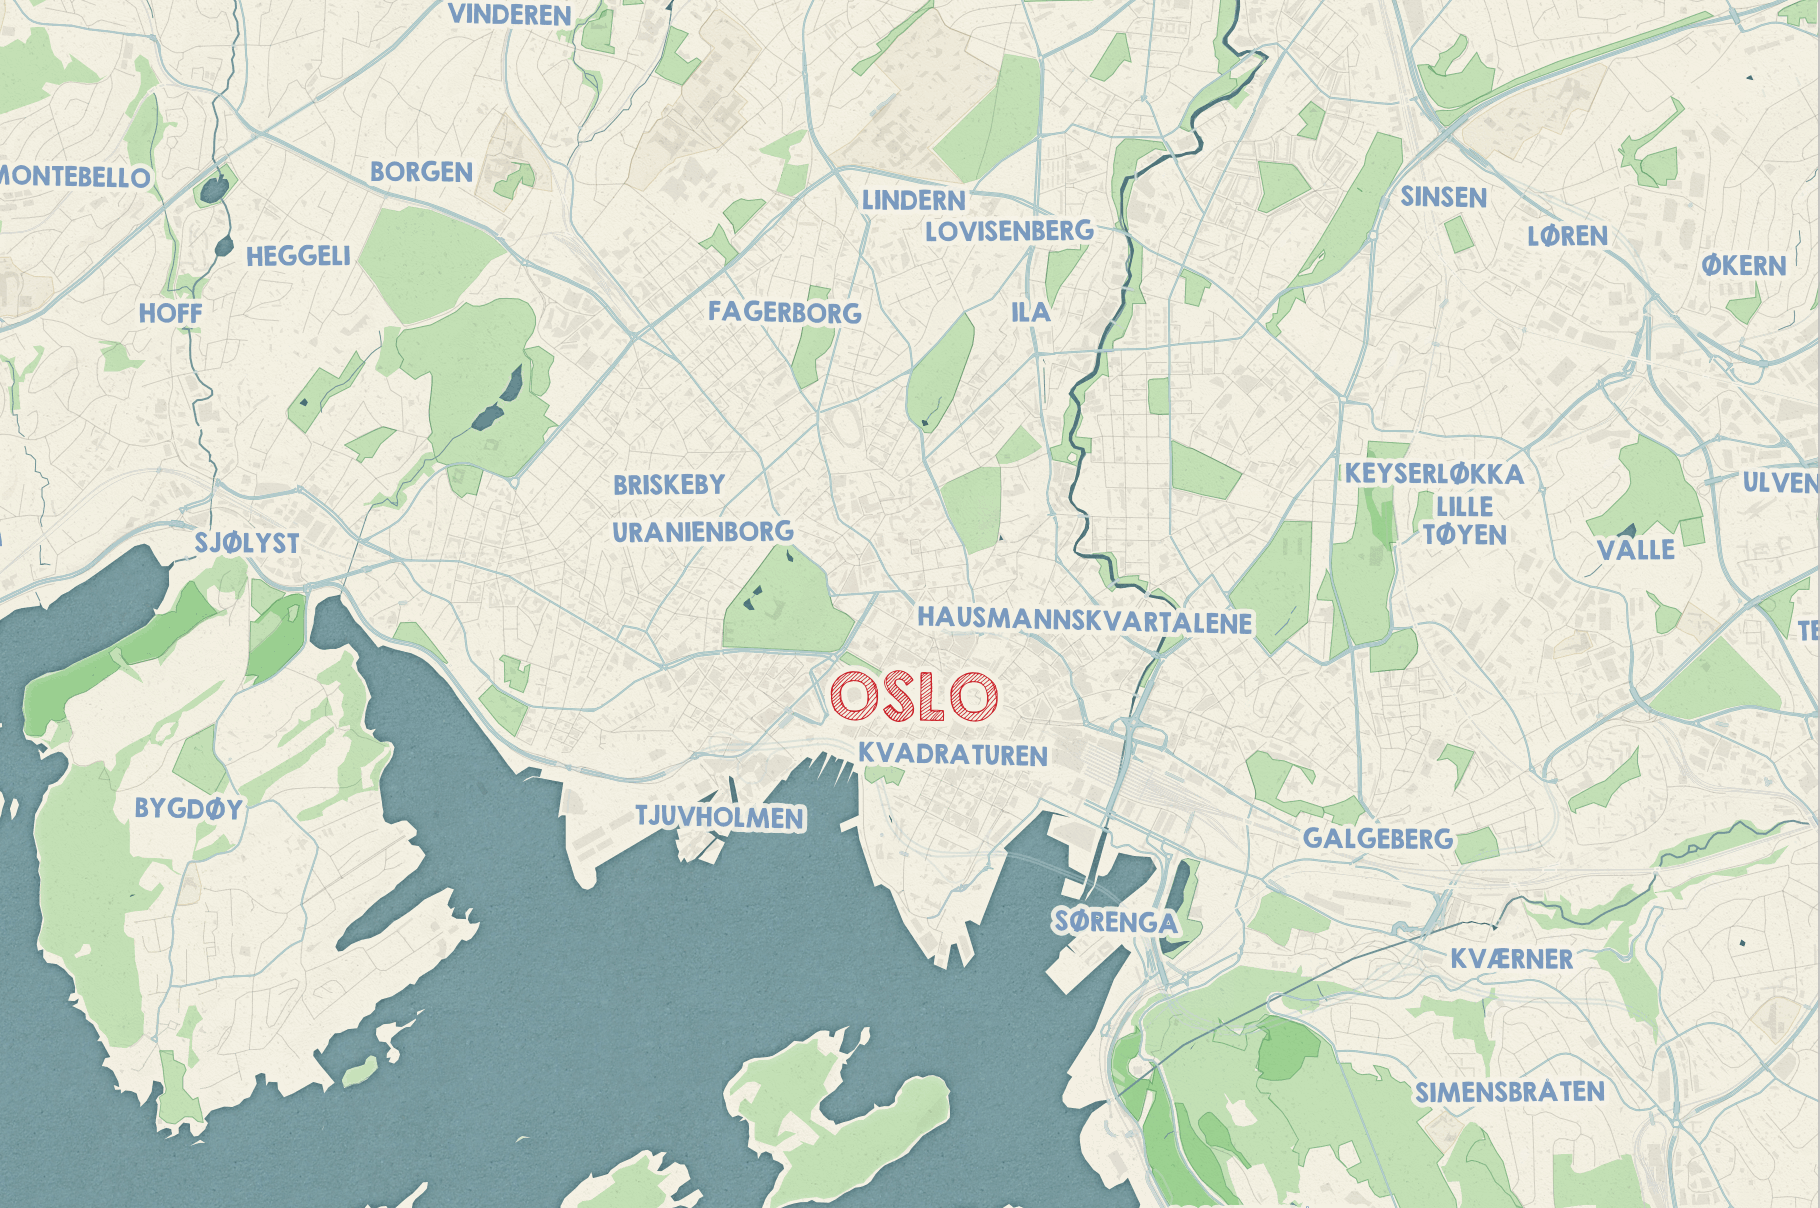
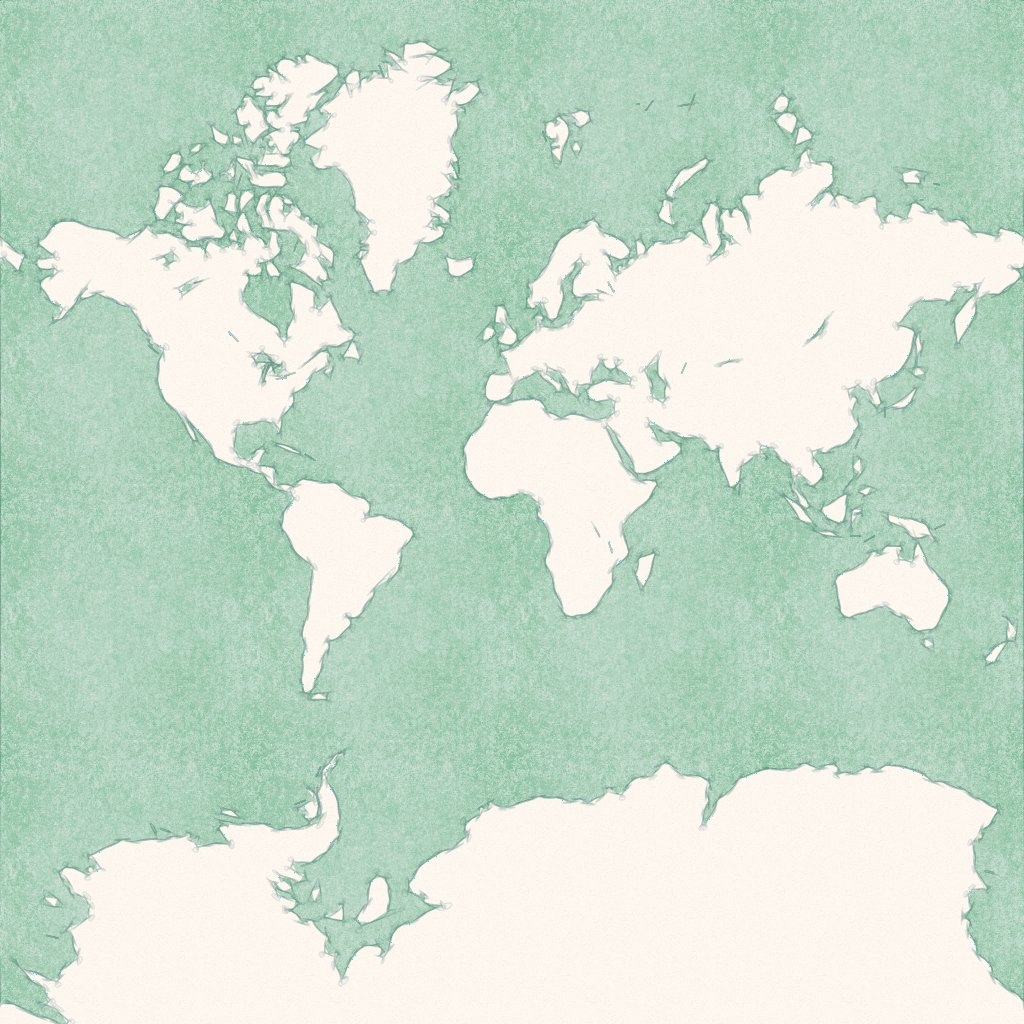
What is a web map?
It's a map in the browser
slippy map
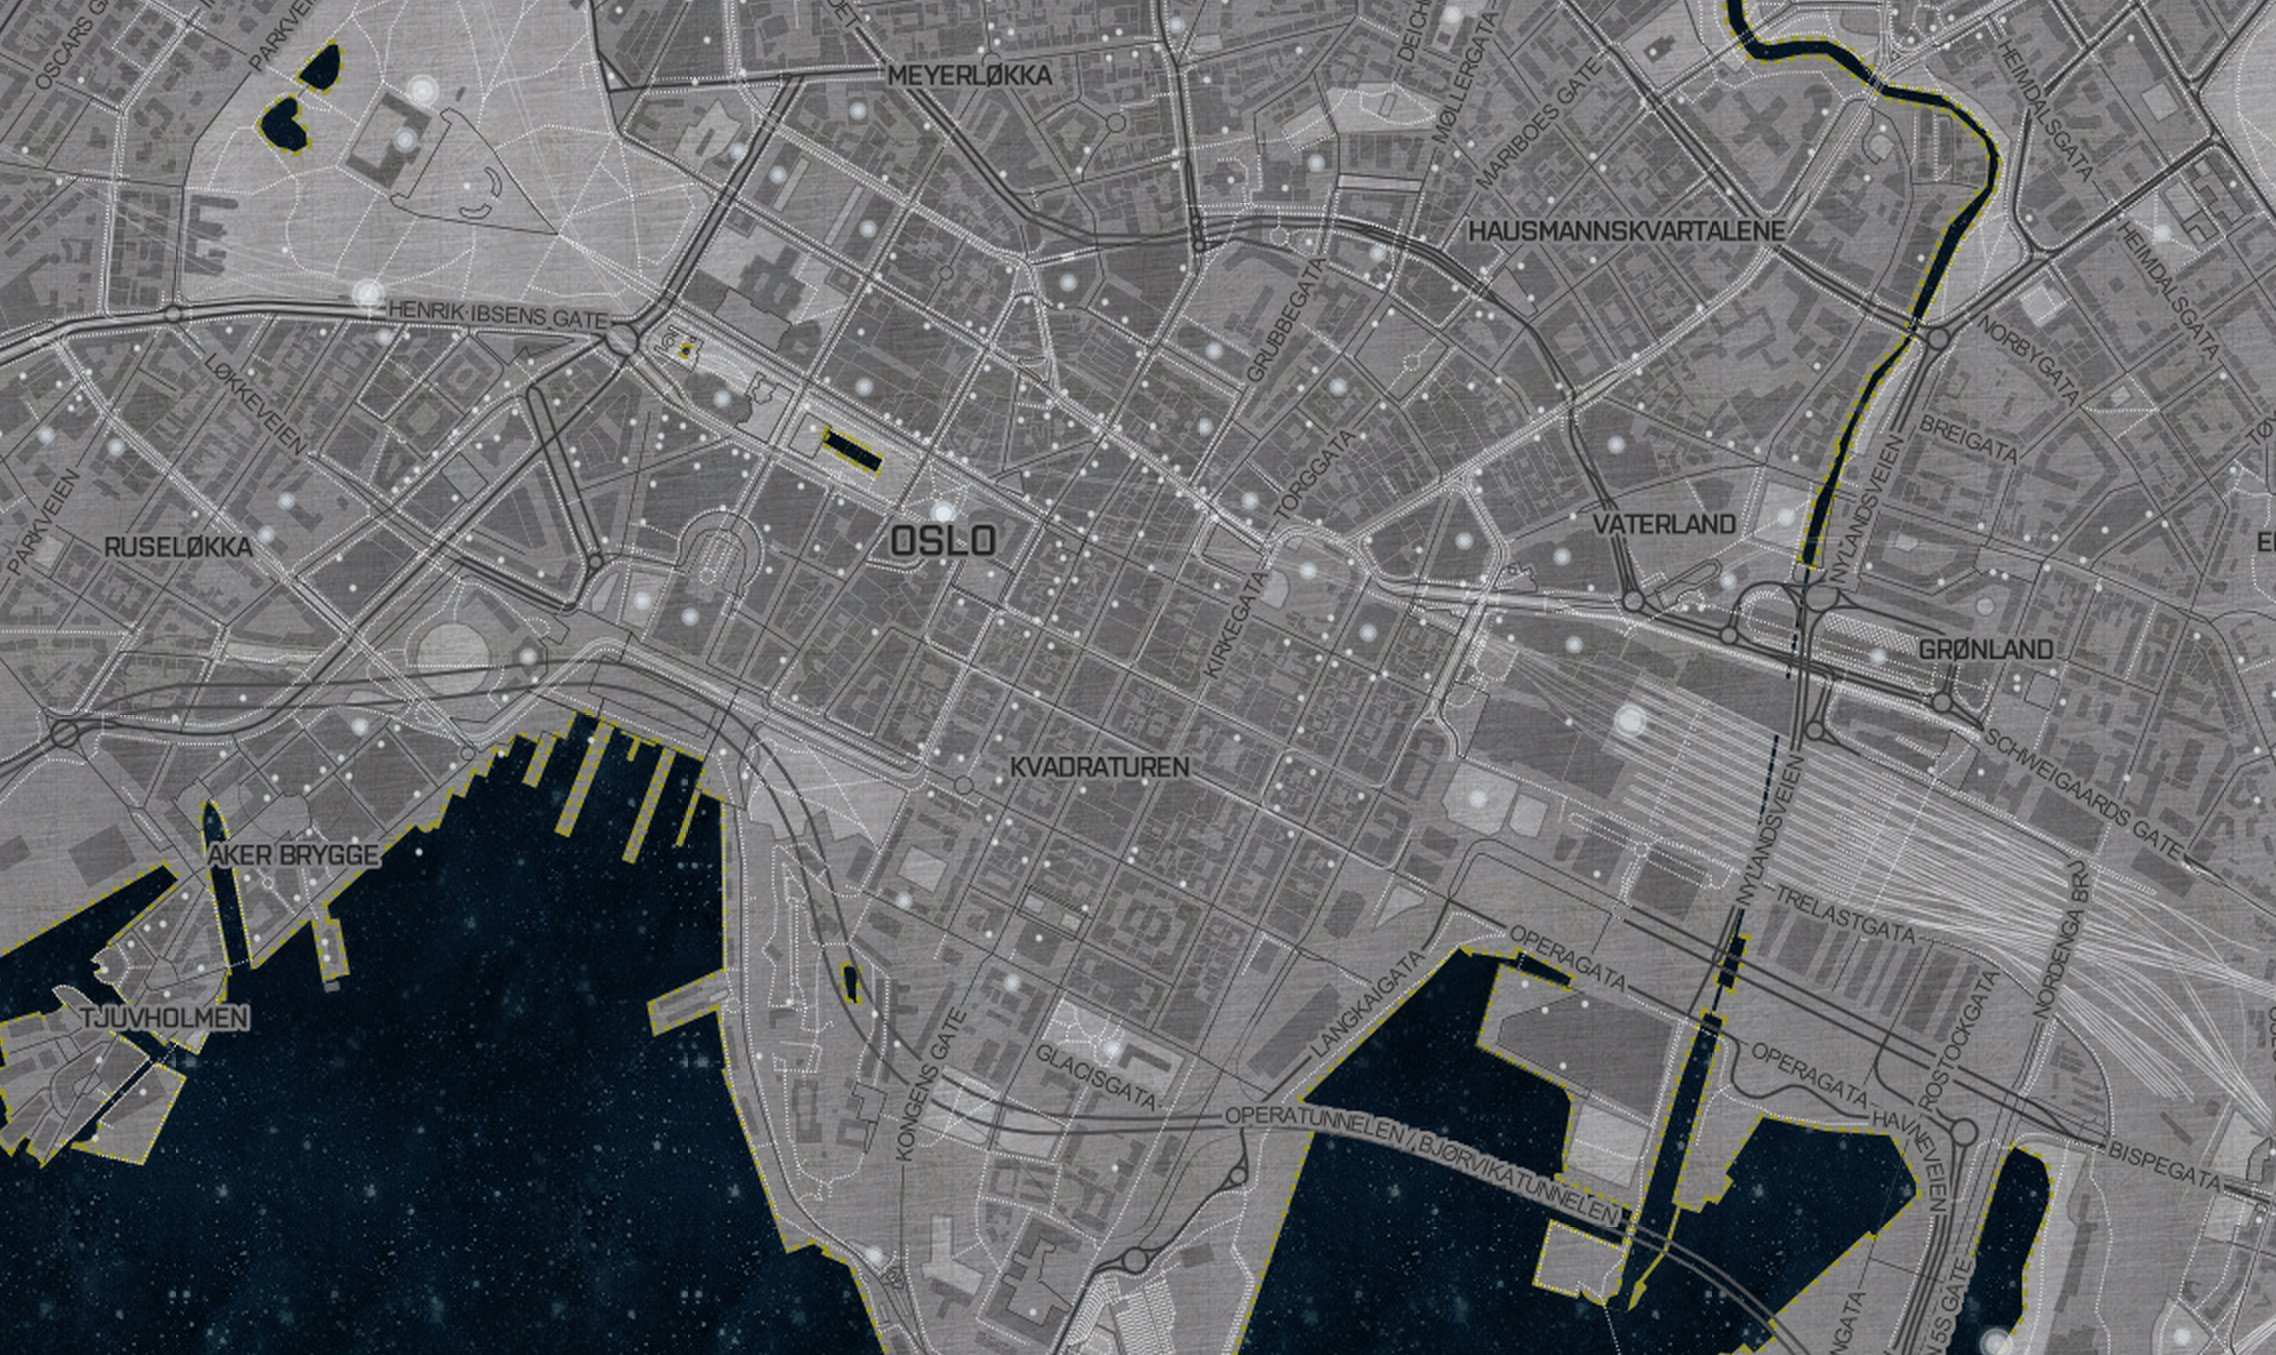
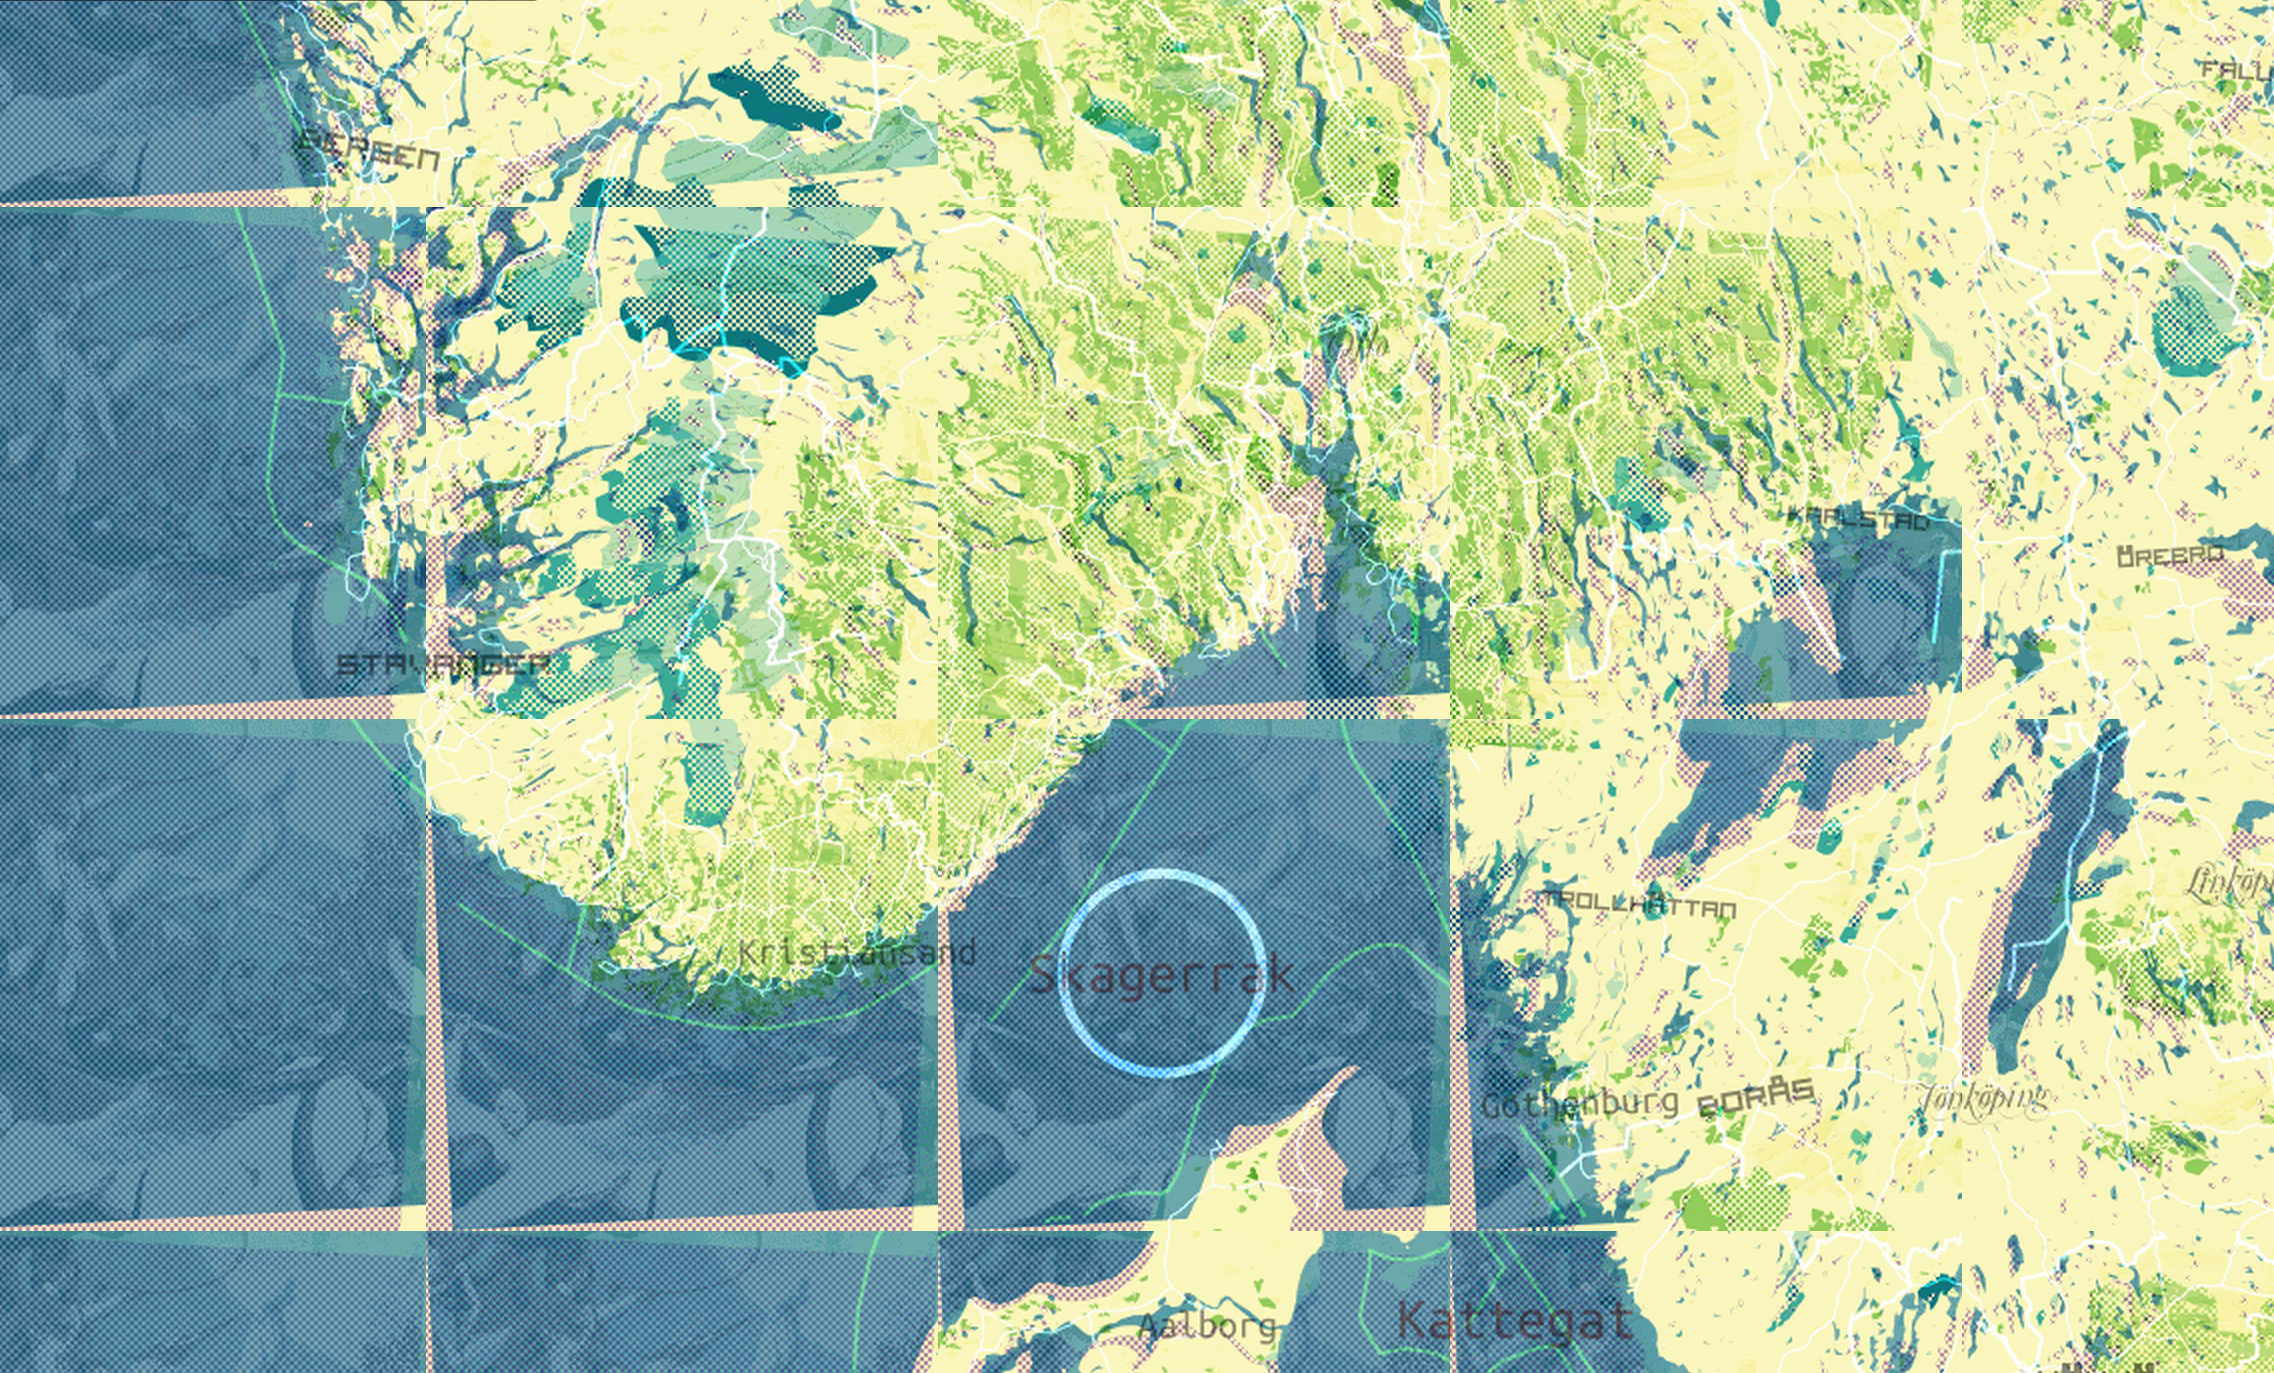
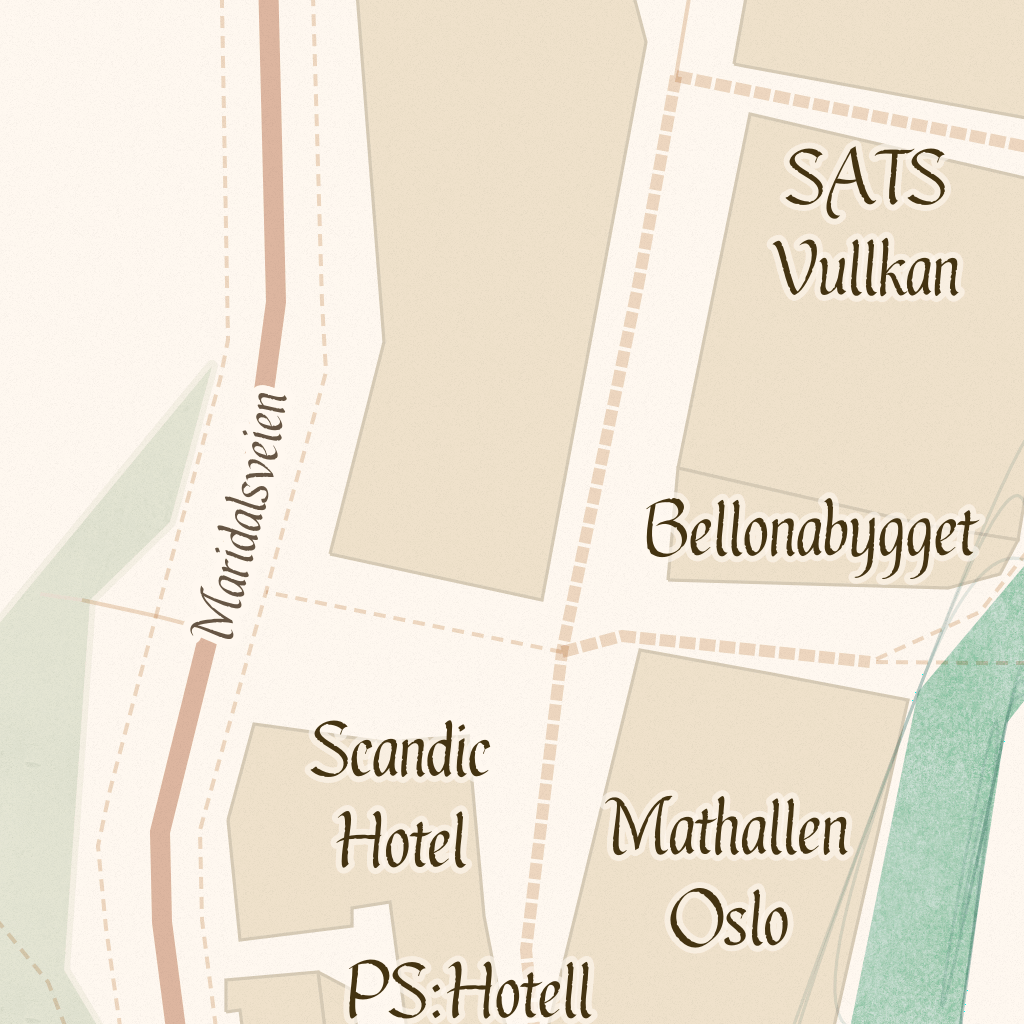
 base layer
 +
data/content/feature layers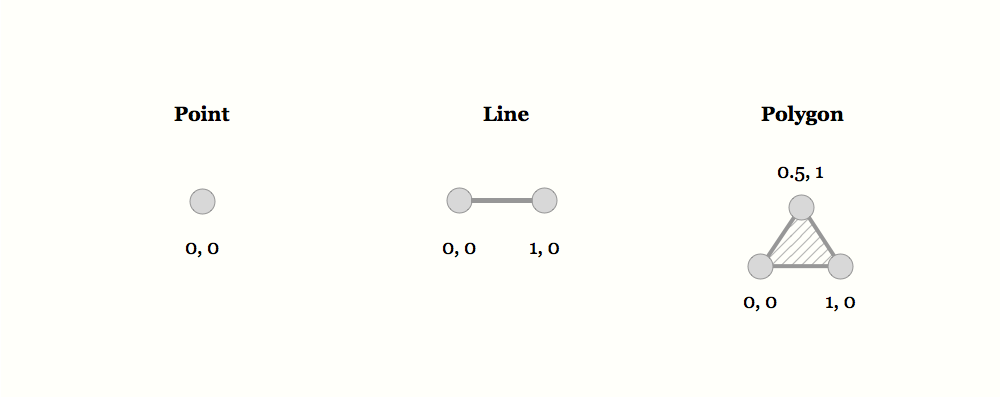
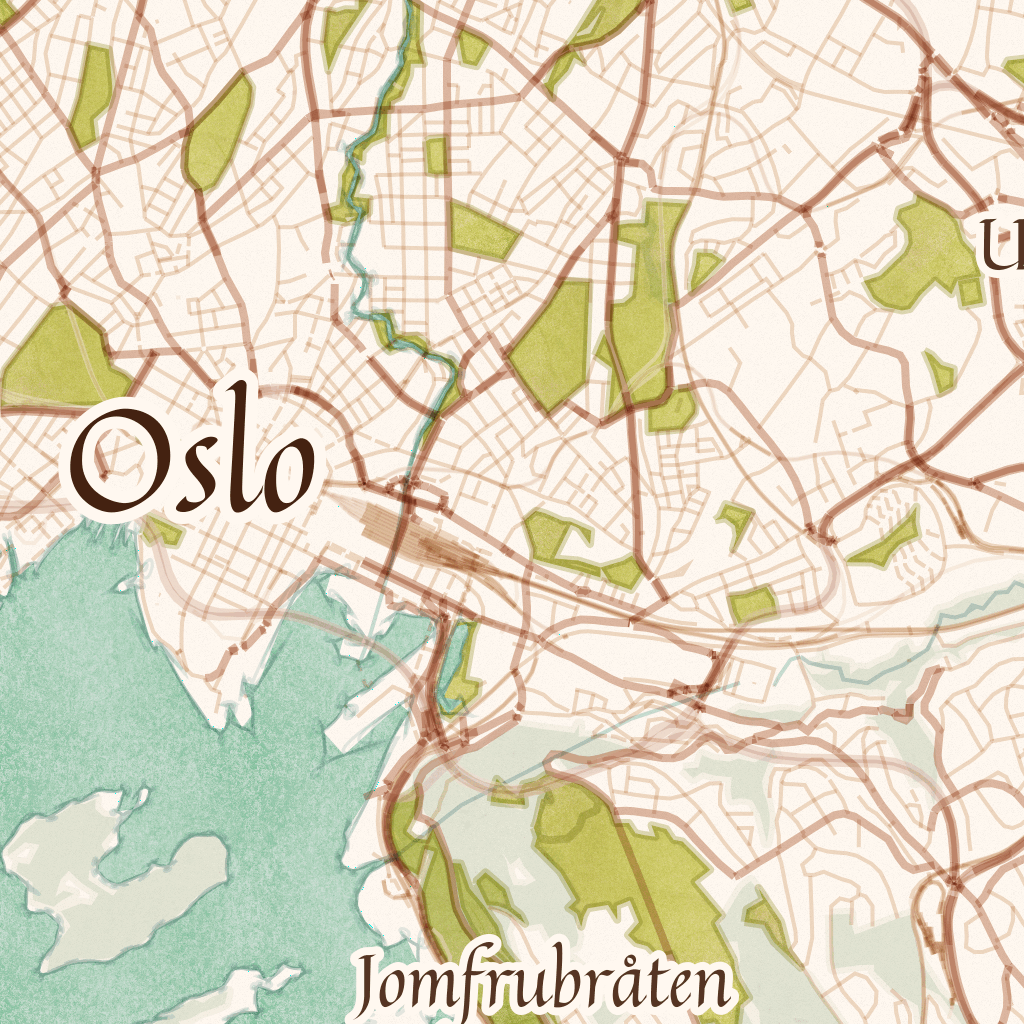
{ 'type': 'Feature', 'properties': { 'SCALERANK': 2, 'NATSCALE': 200, 'LABELRANK': 7, 'FEATURECLA': 'Admin-0 capital', 'NAME': 'Oslo', 'NAMEPAR': null, 'NAMEALT': null, 'DIFFASCII': 0, 'NAMEASCII': 'Oslo', 'ADM0CAP': 1.000000, 'CAPALT': 0.000000, 'CAPIN': null, 'WORLDCITY': 1.000000, 'MEGACITY': 1, 'SOV0NAME': 'Kingdom of Norway', 'SOV_A3': 'NOR', 'ADM0NAME': 'Norway', 'ADM0_A3': 'NOR', 'ADM1NAME': 'Oslo', 'ISO_A2': 'NO', 'NOTE': null, 'LATITUDE': 59.916690, 'LONGITUDE': 10.749979, 'CHANGED': 4.000000, 'NAMEDIFF': 0, 'DIFFNOTE': 'Changed scale rank.', 'POP_MAX': 835000, 'POP_MIN': 580000, 'POP_OTHER': 701804, 'RANK_MAX': 11, 'RANK_MIN': 11, 'GEONAMEID': 3143244.000000, 'MEGANAME': 'Oslo', 'LS_NAME': 'Oslo', 'LS_MATCH': 1, 'CHECKME': 0, 'MAX_POP10': 731563.000000, 'MAX_POP20': 731563.000000, 'MAX_POP50': 762374.000000, 'MAX_POP300': 762374.000000, 'MAX_POP310': 0.000000, 'MAX_NATSCA': 100.000000, 'MIN_AREAKM': 329.000000, 'MAX_AREAKM': 362.000000, 'MIN_AREAMI': 127.000000, 'MAX_AREAMI': 140.000000, 'MIN_PERKM': 340.000000, 'MAX_PERKM': 390.000000, 'MIN_PERMI': 211.000000, 'MAX_PERMI': 243.000000, 'MIN_BBXMIN': 10.333333, 'MAX_BBXMIN': 10.440355, 'MIN_BBXMAX': 11.091667, 'MAX_BBXMAX': 11.091667, 'MIN_BBYMIN': 59.708333, 'MAX_BBYMIN': 59.708333, 'MIN_BBYMAX': 60.066667, 'MAX_BBYMAX': 60.066667, 'MEAN_BBXC': 10.756508, 'MEAN_BBYC': 59.906118, 'COMPARE': 0, 'GN_ASCII': 'Oslo', 'FEATURE_CL': 'P', 'FEATURE_CO': 'PPLC', 'ADMIN1_COD': 12.000000, 'GN_POP': 580000.000000, 'ELEVATION': 0.000000, 'GTOPO30': 11.000000, 'TIMEZONE': 'Europe\/Oslo', 'GEONAMESNO': 'GeoNames match general.', 'UN_FID': 397, 'UN_ADM0': 'Norway', 'UN_LAT': 59.930000, 'UN_LONG': 10.710000, 'POP1950': 468.000000, 'POP1955': 533.000000, 'POP1960': 578.000000, 'POP1965': 610.000000, 'POP1970': 643.000000, 'POP1975': 644.000000, 'POP1980': 643.000000, 'POP1985': 662.000000, 'POP1990': 684.000000, 'POP1995': 729.000000, 'POP2000': 774.000000, 'POP2005': 816.000000, 'POP2010': 835.000000, 'POP2015': 858.000000, 'POP2020': 885.000000, 'POP2025': 909.000000, 'POP2050': 936.000000, 'CITYALT': null }, 'geometry': { 'type': 'Point', 'coordinates': [ 10.748033347372314, 59.918636145001869 ] } }
regardless of what format your data is, it's just arrays of (lat,lon) or (lon,lat) coordinates
Thankfully, we've done away with degrees and points in web mapping
38° 12'
for 38.2
[ -122.7324524, 37.9023387 ], [ -122.7324012, 37.9022282 ], [ -122.7323451, 37.9021191 ], [ -122.7322844, 37.9020117 ], [ -122.732219, 37.9019059 ], [ -122.732149, 37.9018021 ], [ -122.7320746, 37.9017002 ], [ -122.7312819, 37.9006205 ], [ -122.731242, 37.9005806 ], [ -122.7312004, 37.9005417 ], [ -122.7311572, 37.900504 ], [ -122.7311124, 37.9004675 ], [ -122.731066, 37.9004322 ], [ -122.7310181, 37.9003982 ], [ -122.7309688, 37.9003655 ], [ -122.7309181, 37.9003341 ], [ -122.7308661, 37.9003042 ], [ -122.7308128, 37.9002756 ], [ -122.7307584, 37.9002484 ], [ -122.7307028, 37.9002229 ], [ -122.7306461, 37.9001988 ], [ -122.7305885, 37.9001763 ], [ -122.7305299, 37.9001553 ], [ -122.7304704, 37.9001359 ], [ -122.7304102, 37.9001181 ], [ -122.7303492, 37.9001019 ], [ -122.7302875, 37.9000875 ], [ -122.7136174, 37.8964147 ], [ -122.7127163, 37.8996543 ], [ -122.7127335, 37.8996637 ], [ -122.7129412, 37.8997974 ], [ -122.7133378, 37.9000575 ], [ -122.7134057, 37.9001333 ], [ -122.712969, 37.9003811 ], [ -122.7039721, 37.9054847 ]
Latitude goes North to South!
it's 90 to 0 to -90
Longitude goes East to West!
it's 180 to 0 to -180
(aka, the long way)
(Lng, Lat) === (x, y)
But coordinate order isn't standardized.
It's terrible
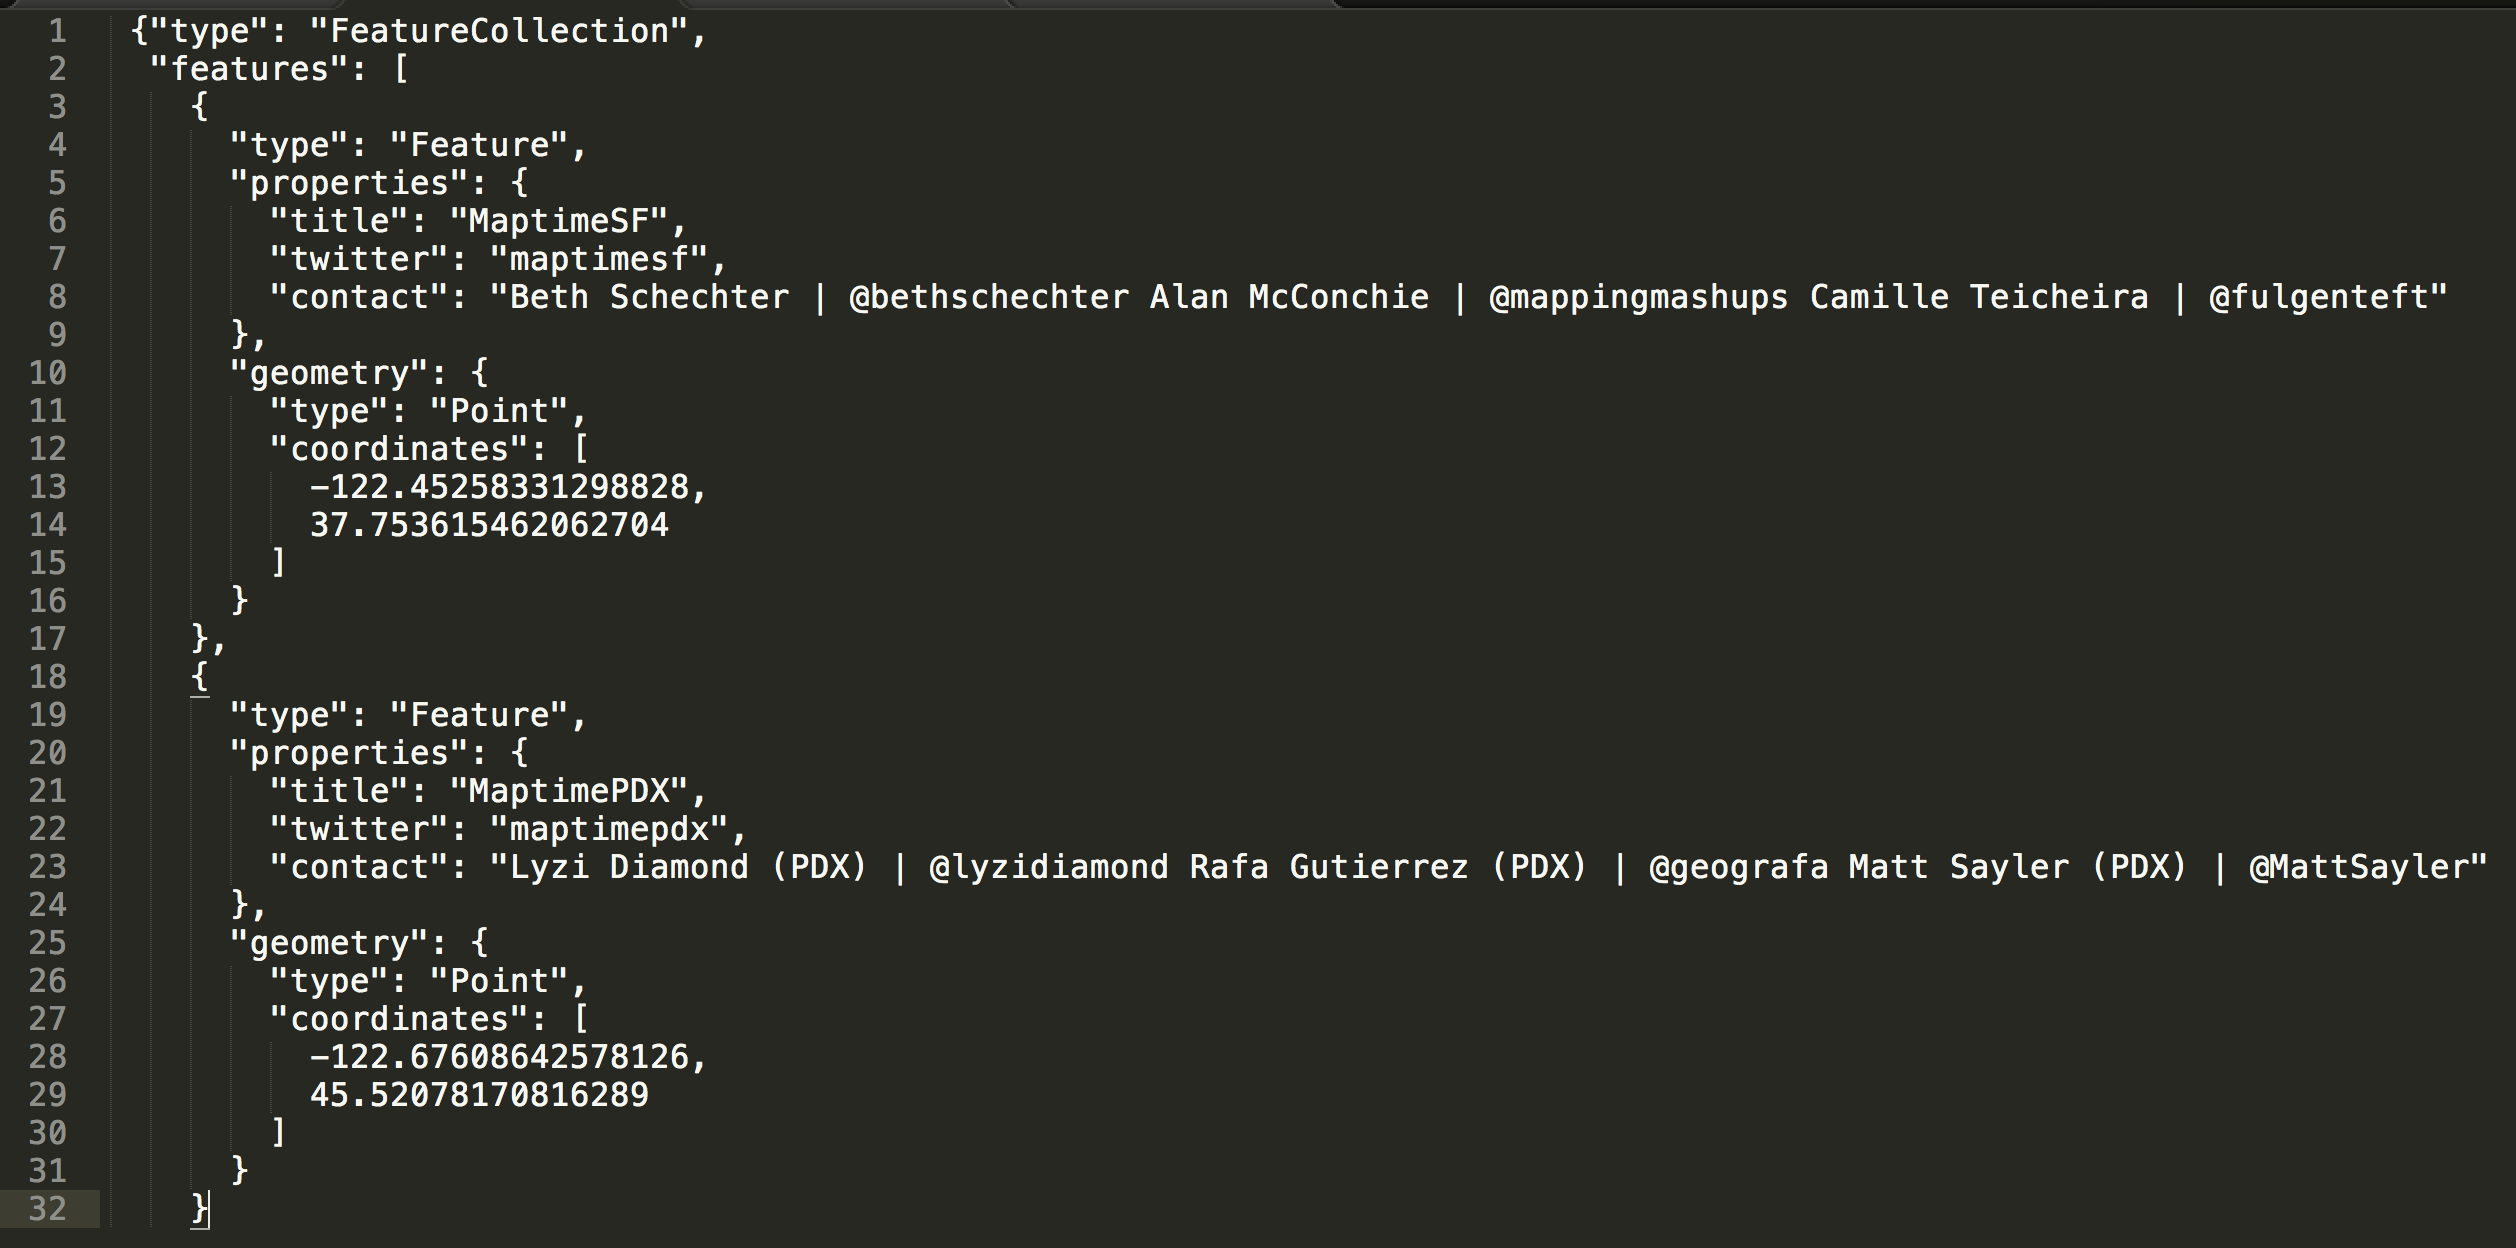
Use geojson
GeoJSON supports the following geometry types:
Point, LineString, Polygon, MultiPoint, MultiLineString, and MultiPolygon.
Lists of geometries are represented by a GeometryCollection.
Geometries with additional properties are Feature objects.
And lists of features are represented by a FeatureCollection.
it's json, but with more stuff, geo stuff.
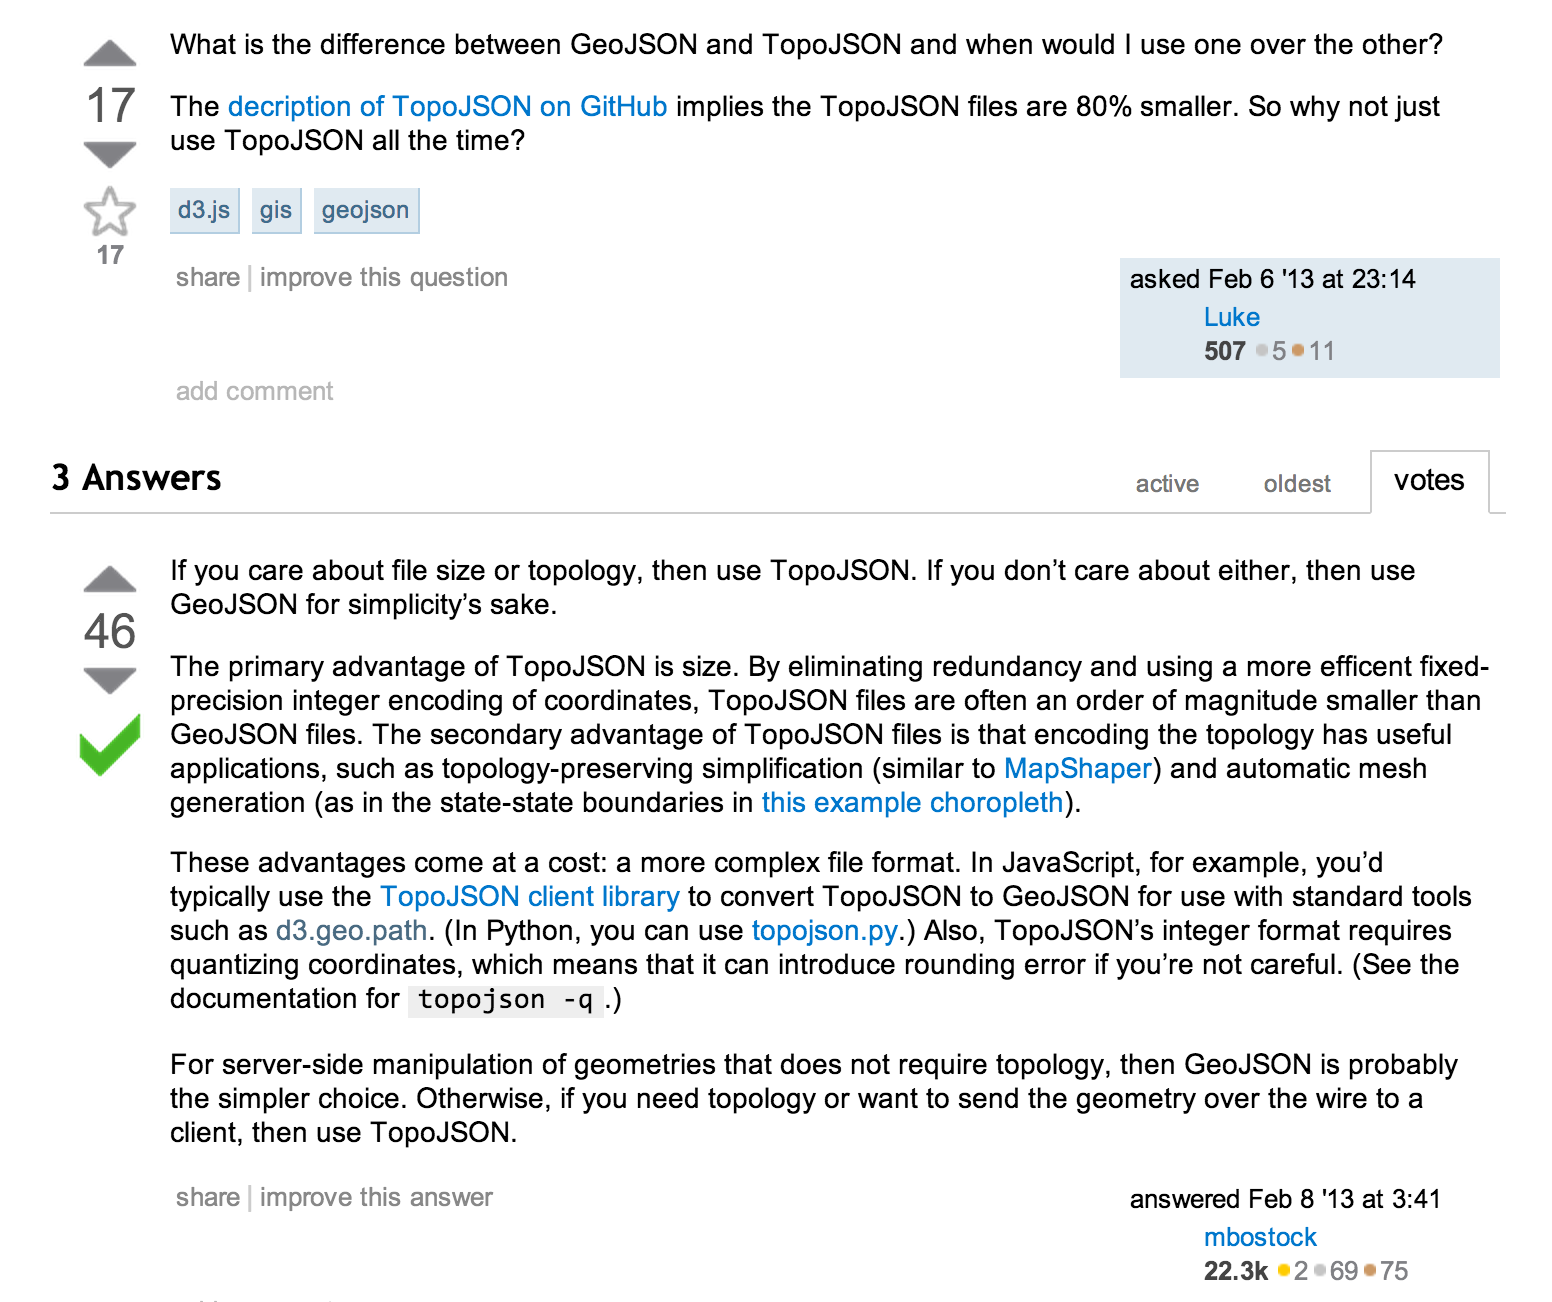
Or topojson
npm install -g topojson
 topology!
Just use geojson
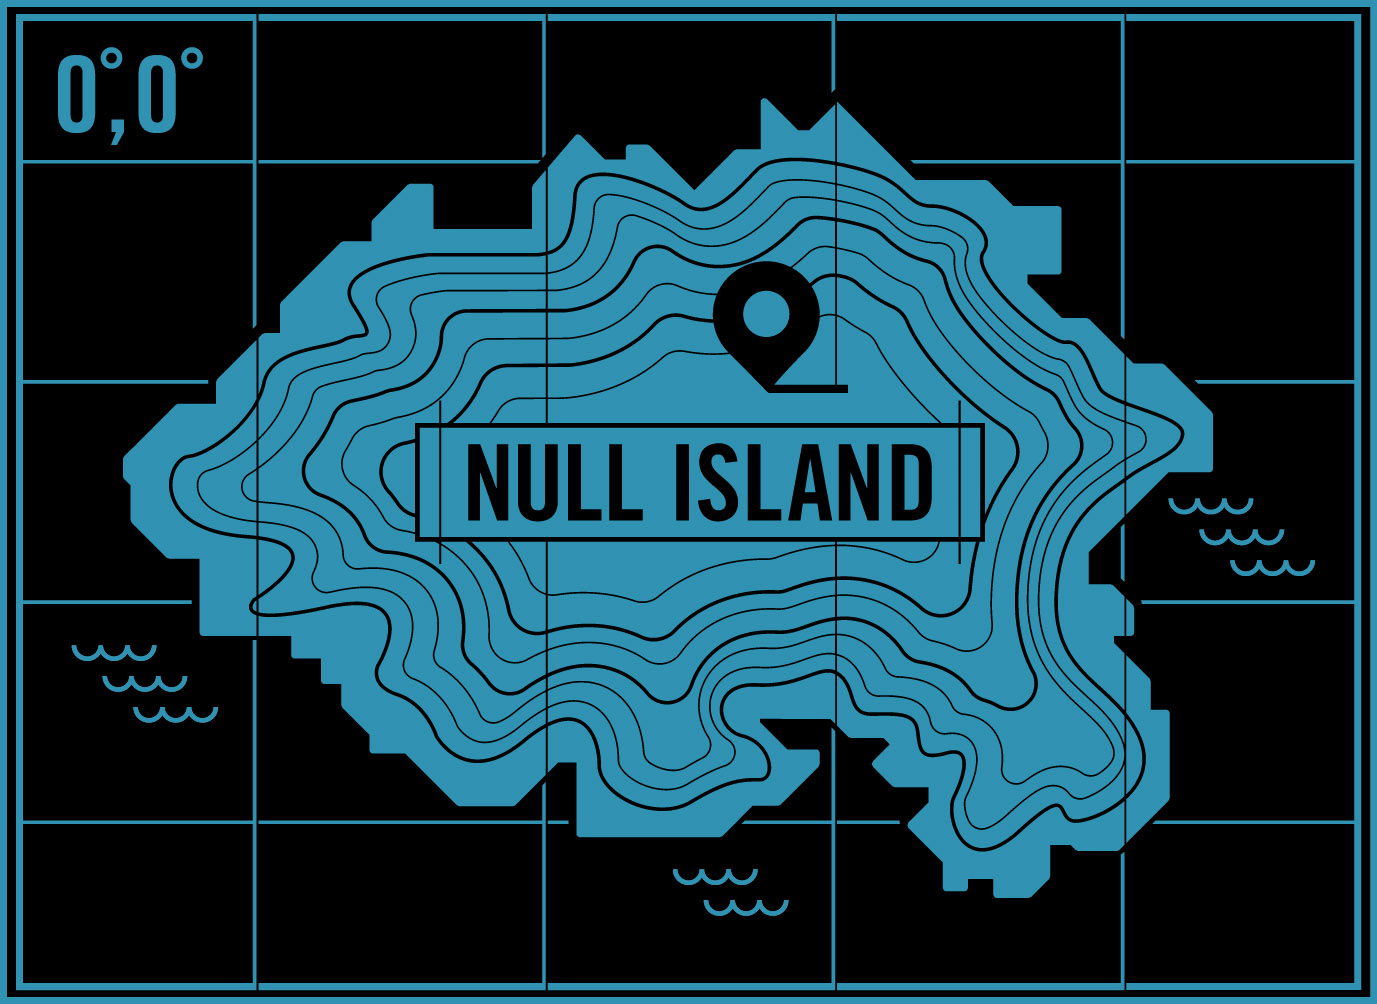
Quick trip to Null Island
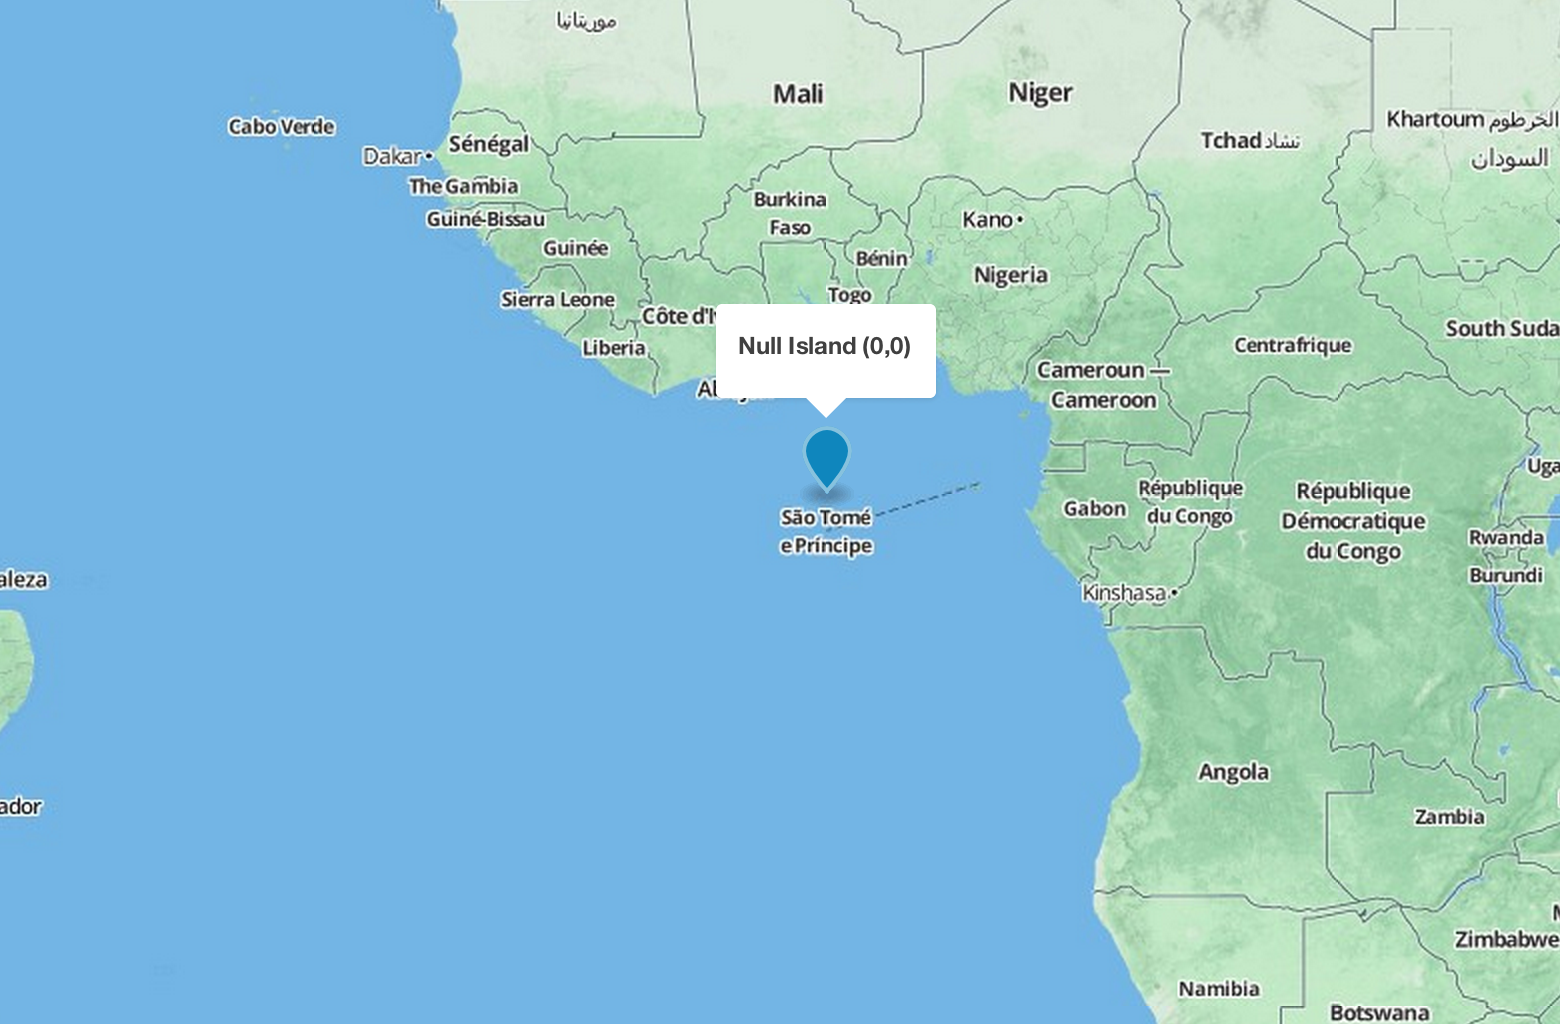
(0, 0)
what do I do with this data?
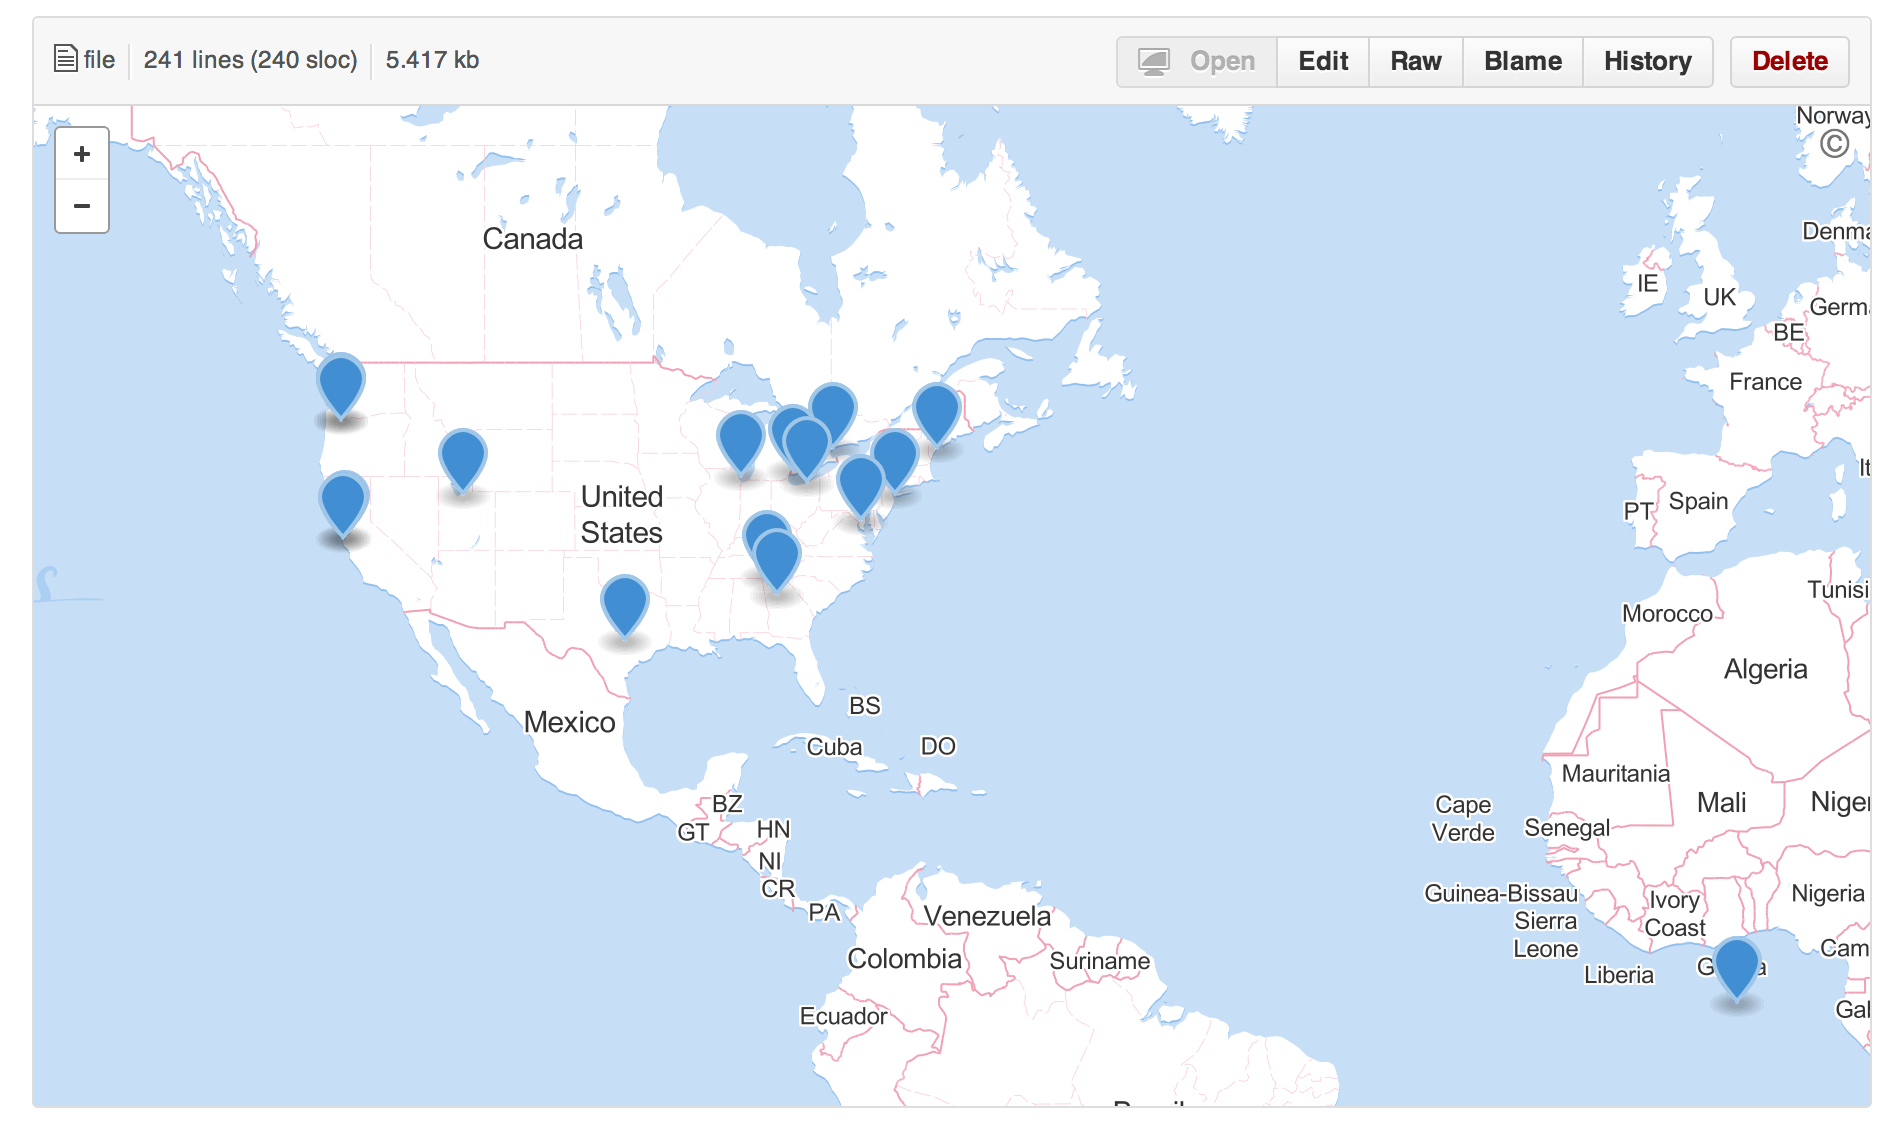
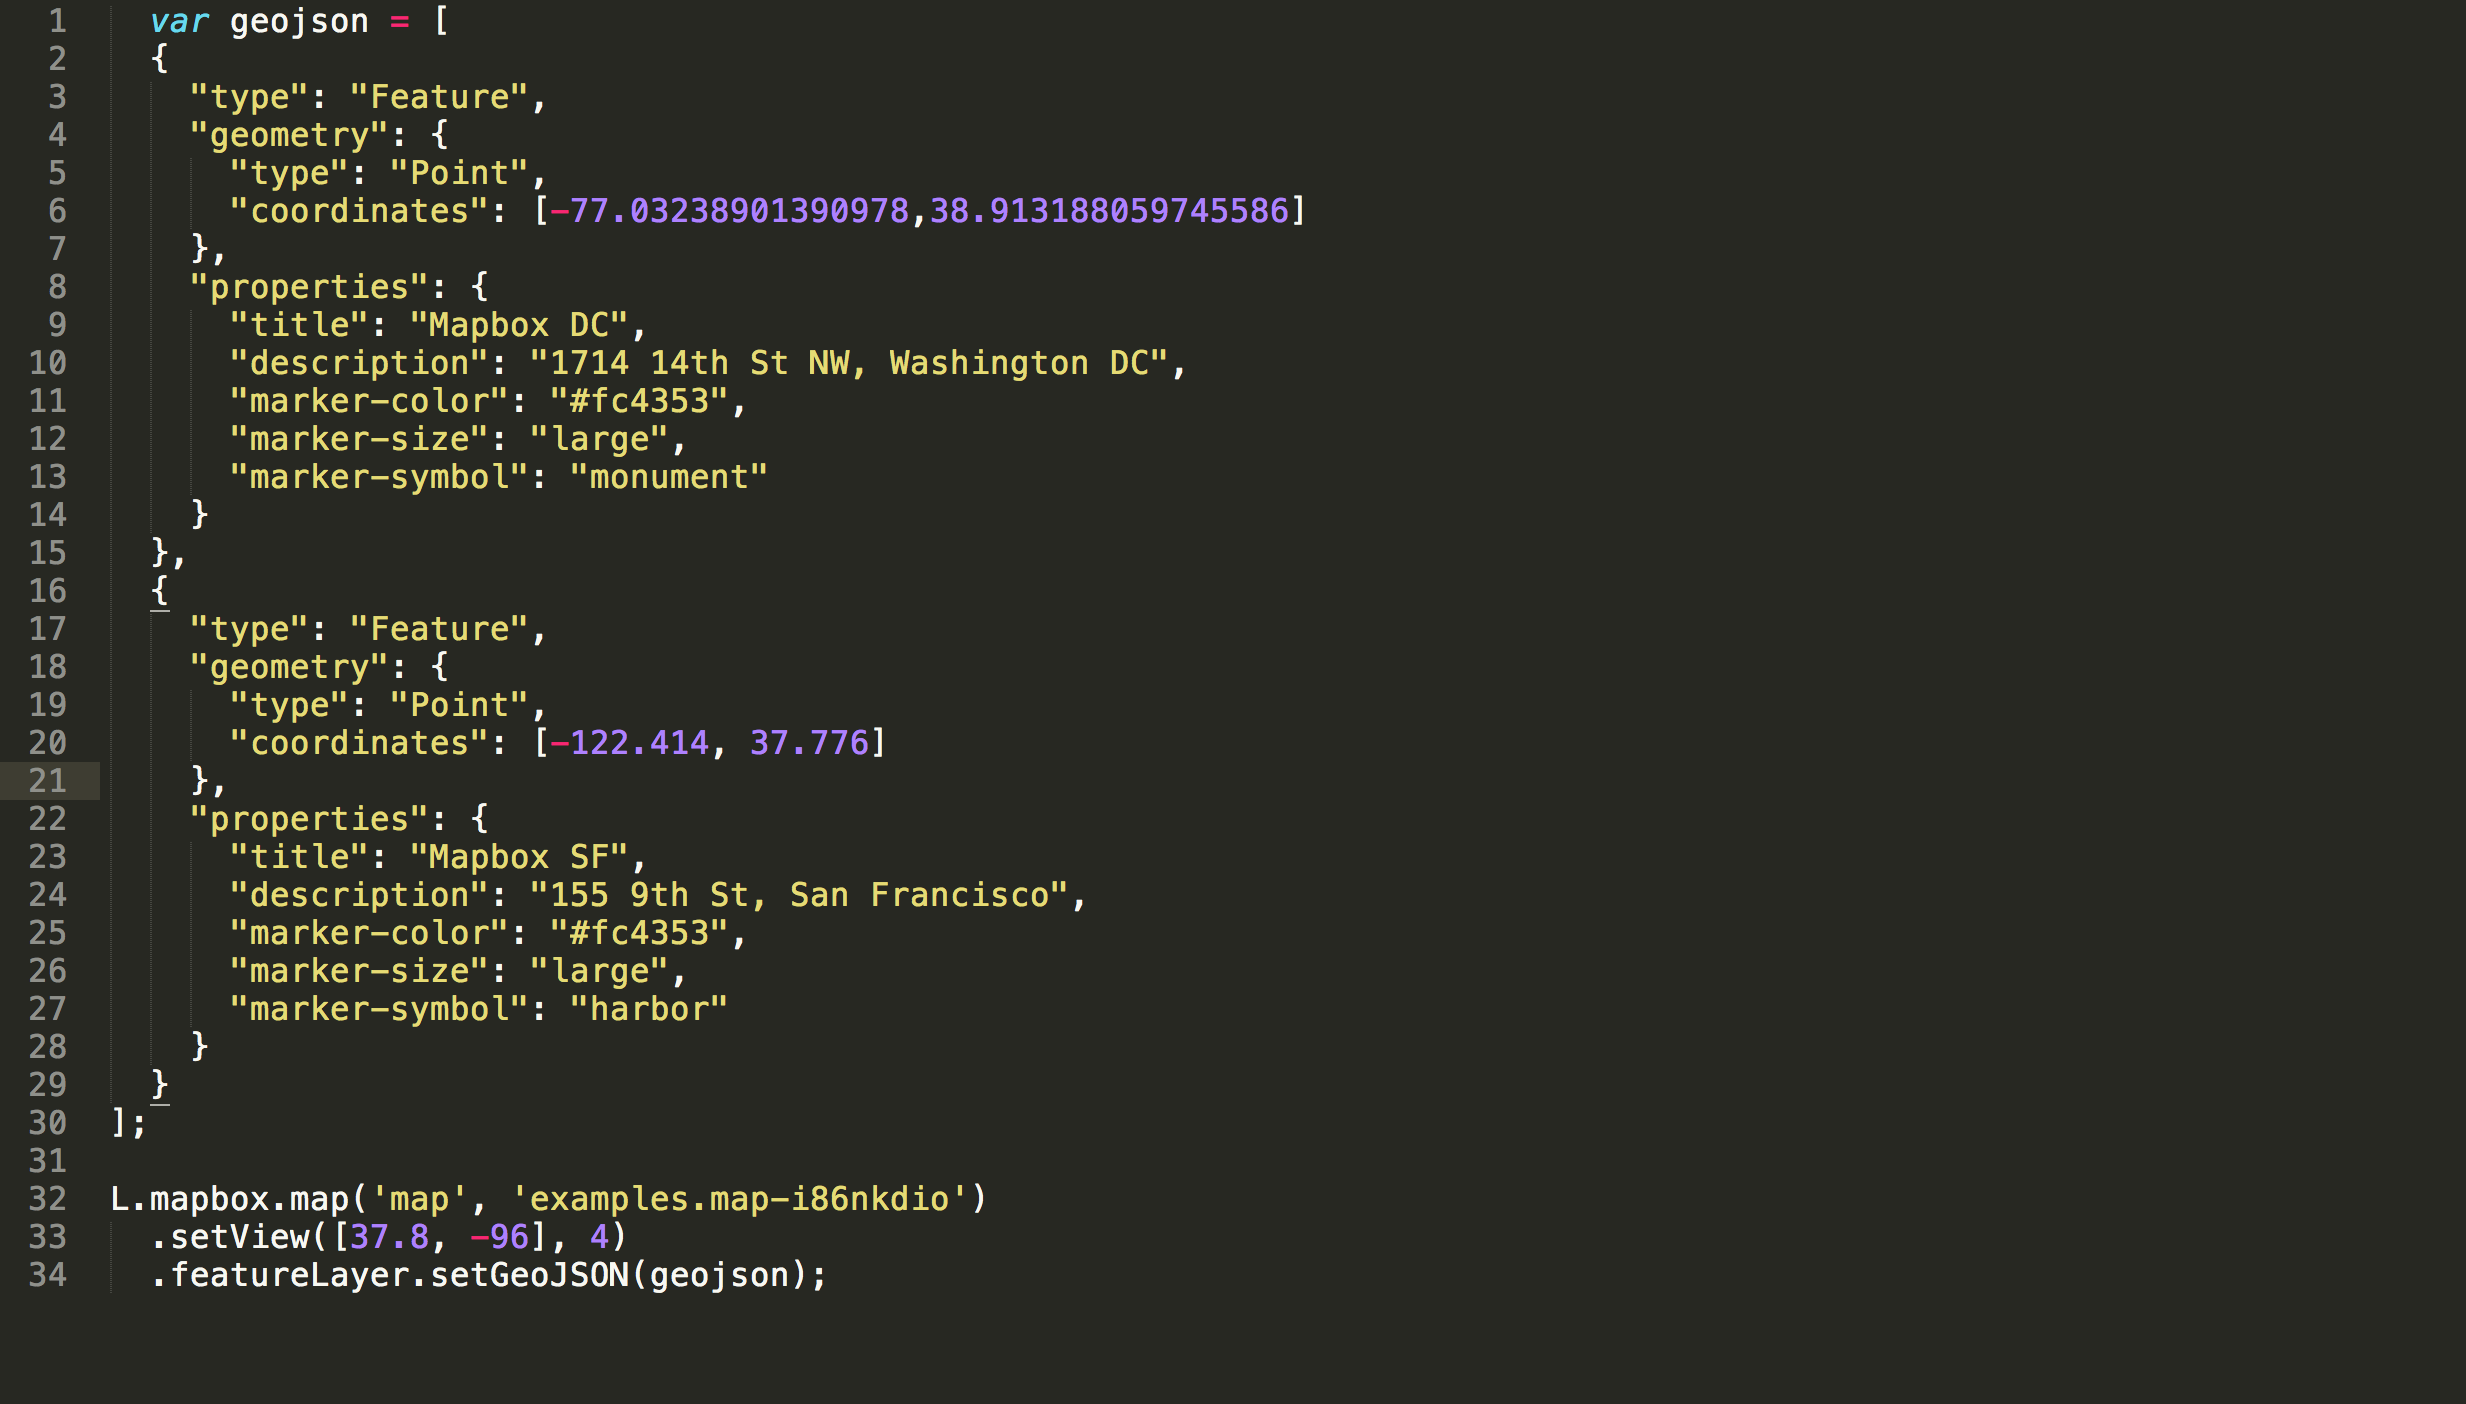
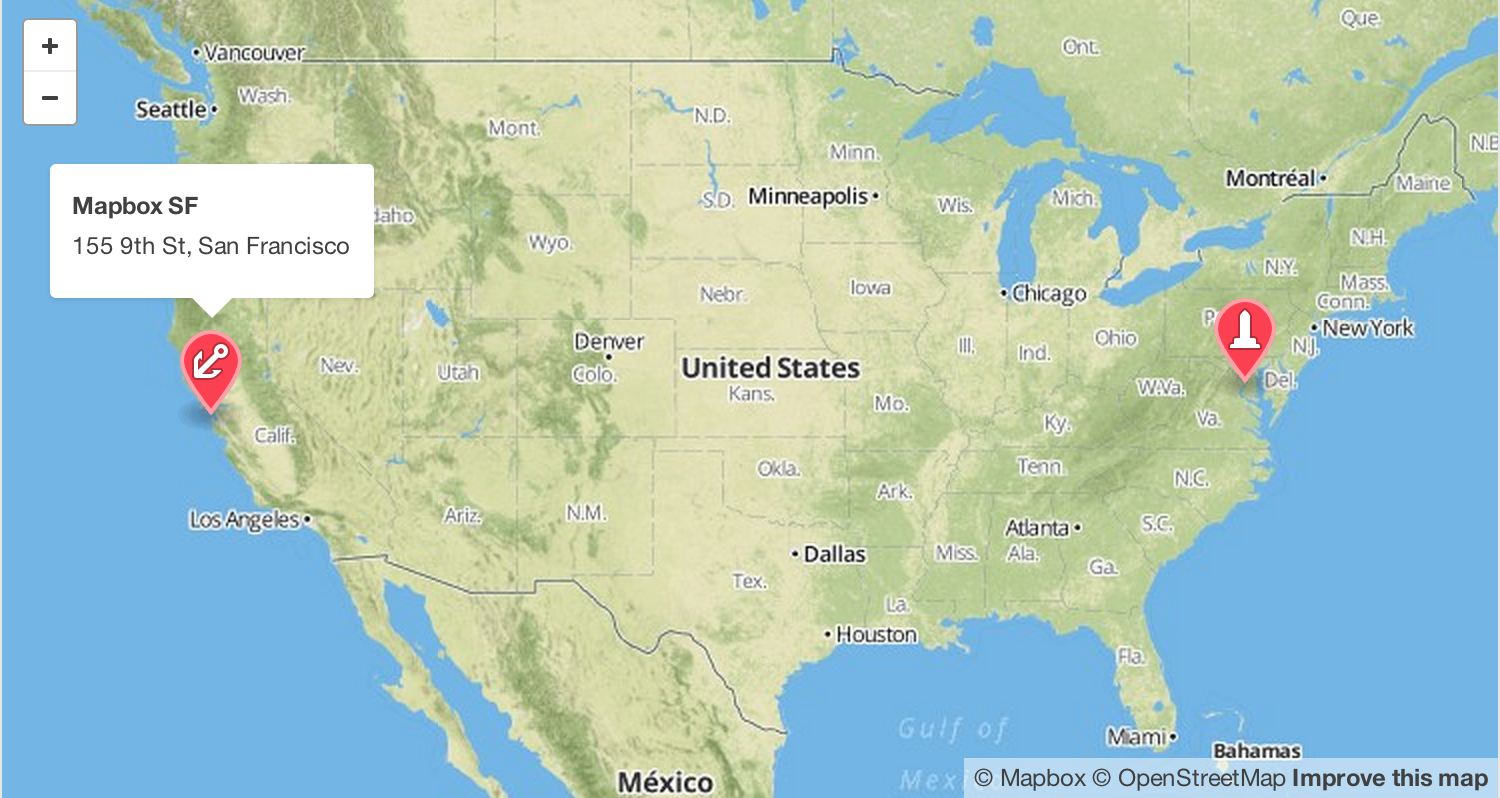
1: Commit GeoJSON to Github
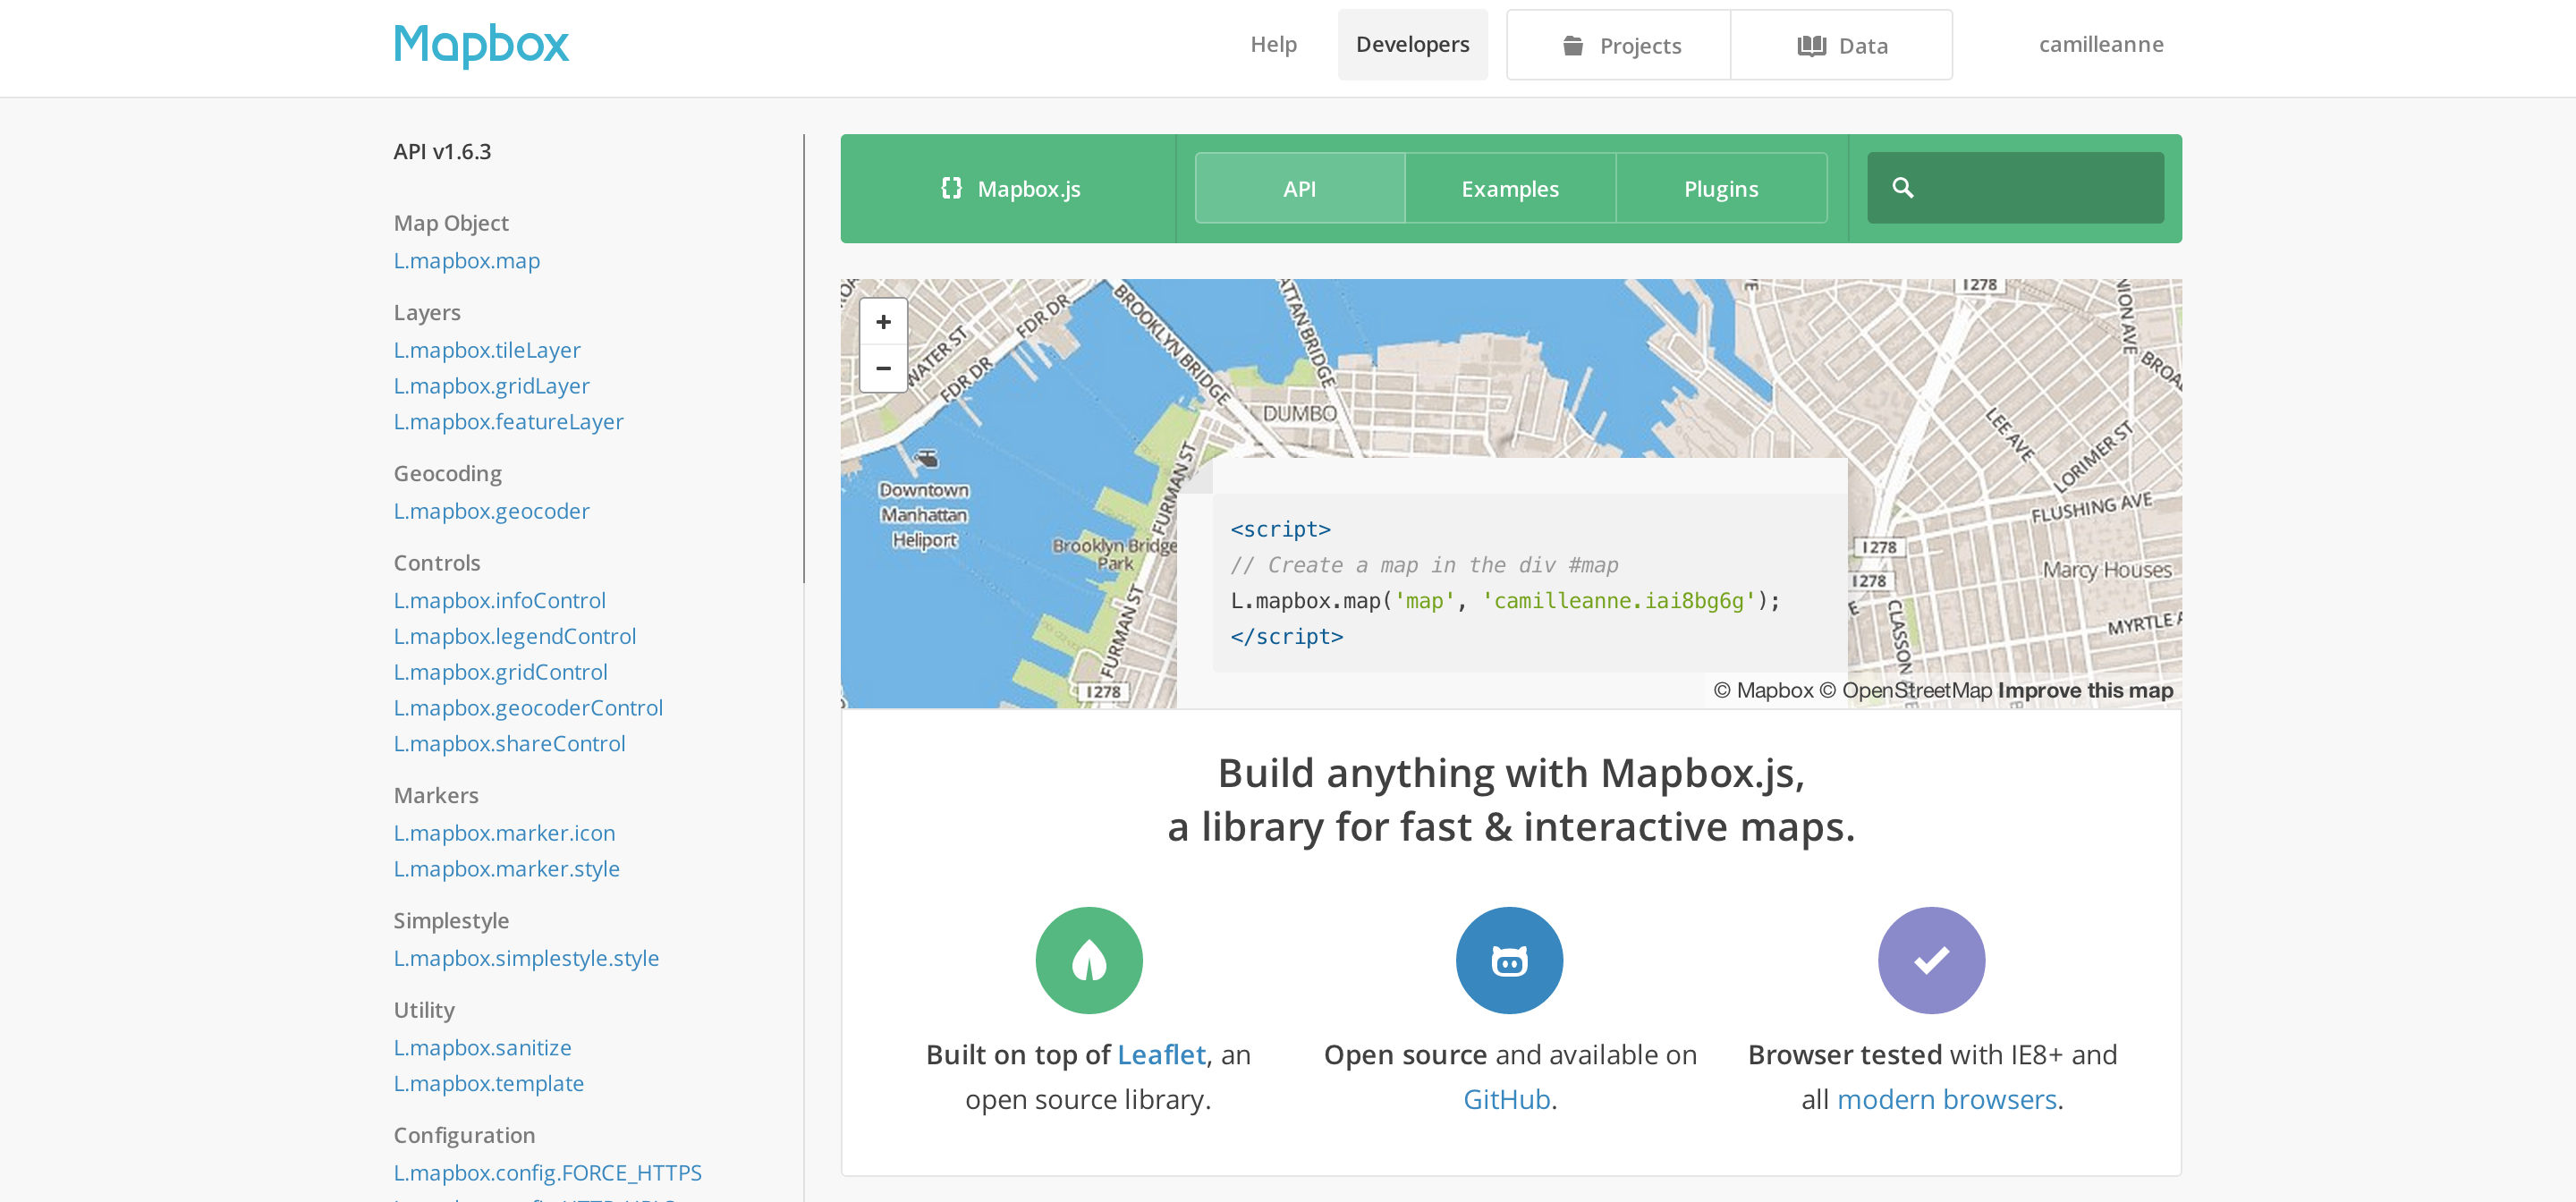
2: Mapbox.com -> Editor -> Drag and drop GeoJSON
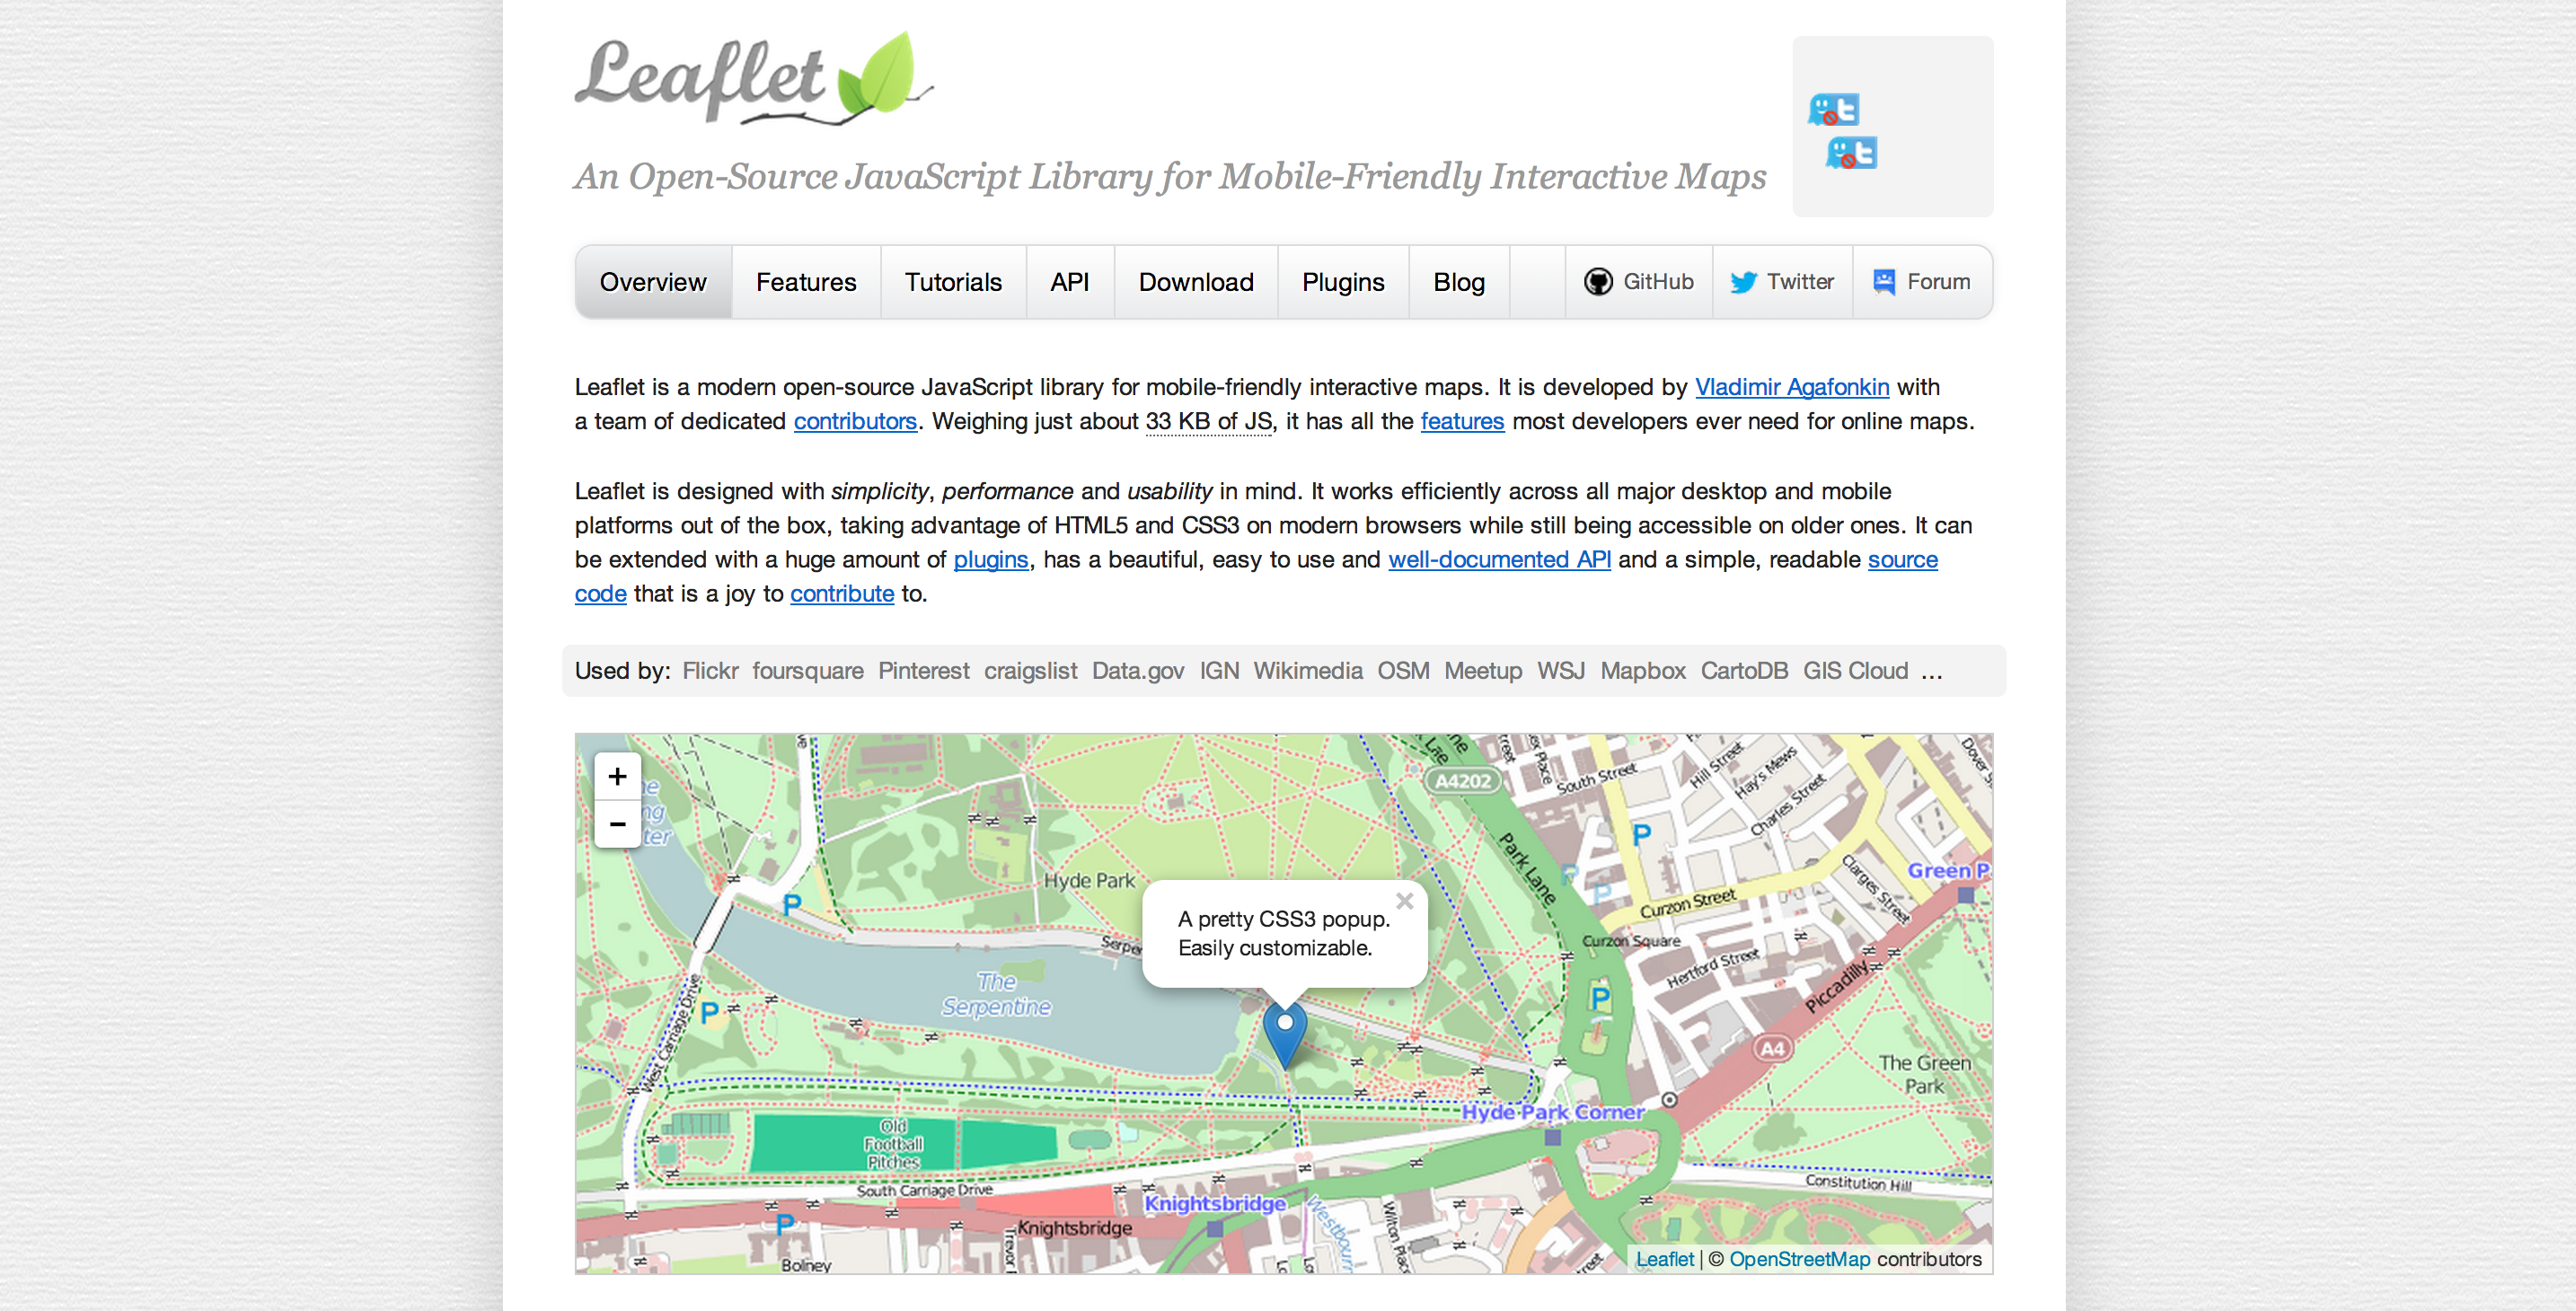
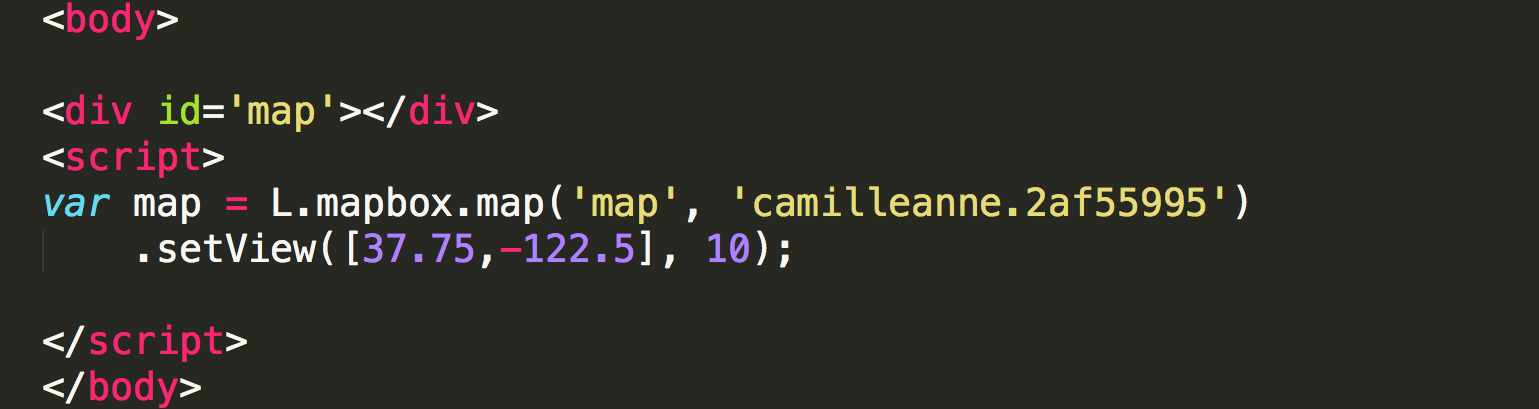
3: Use a mapping library: Leaflet.js or Mapbox.js
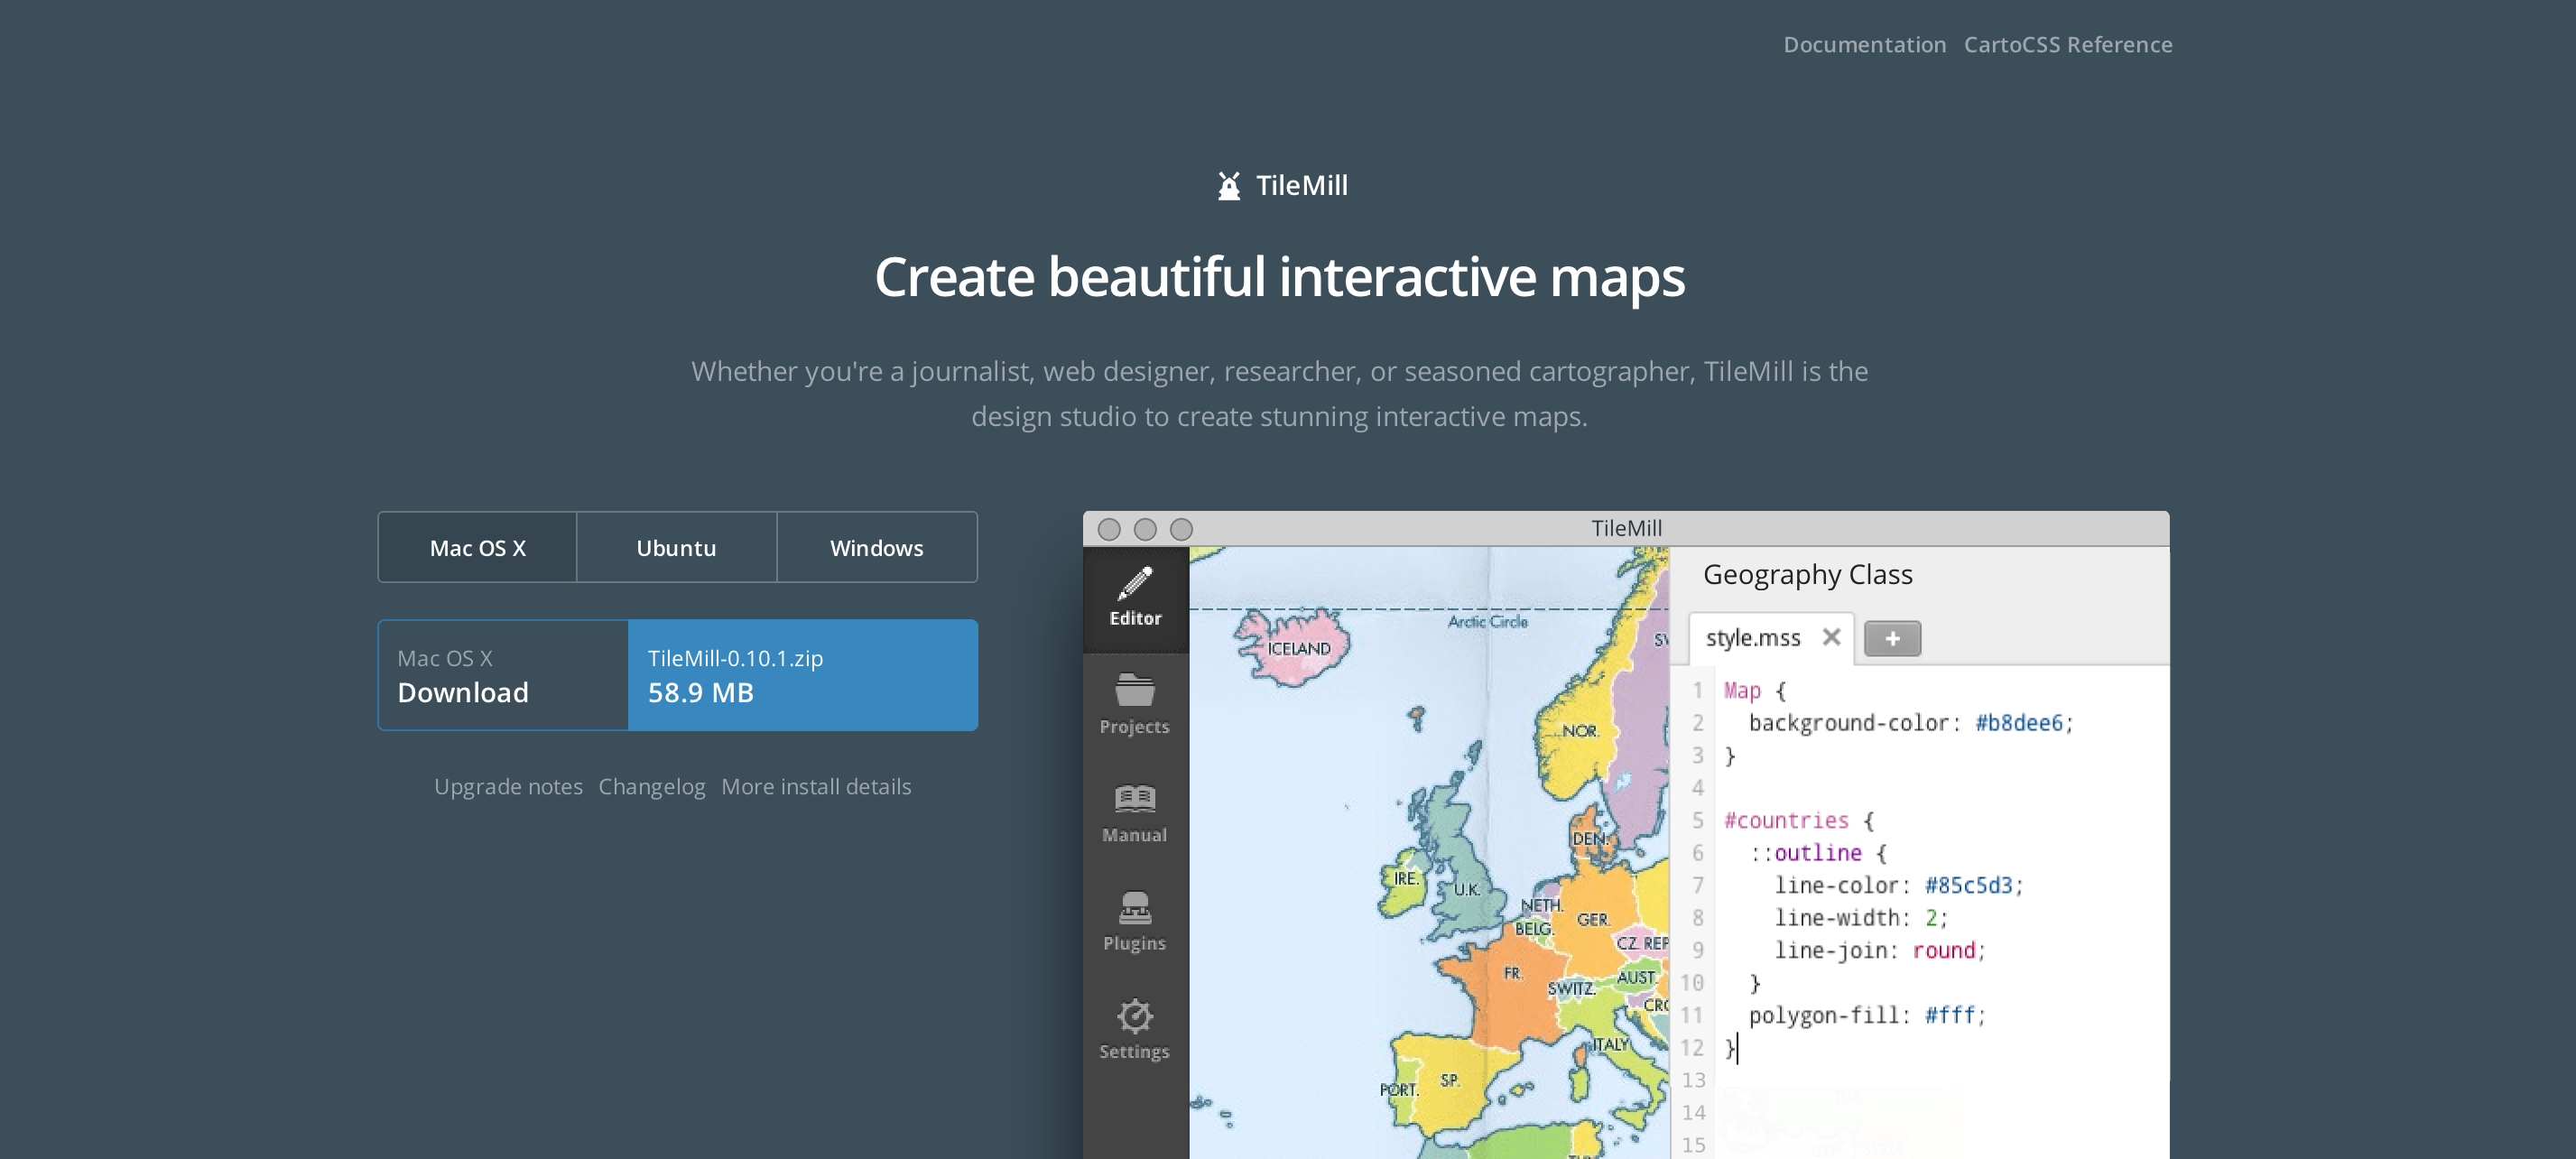
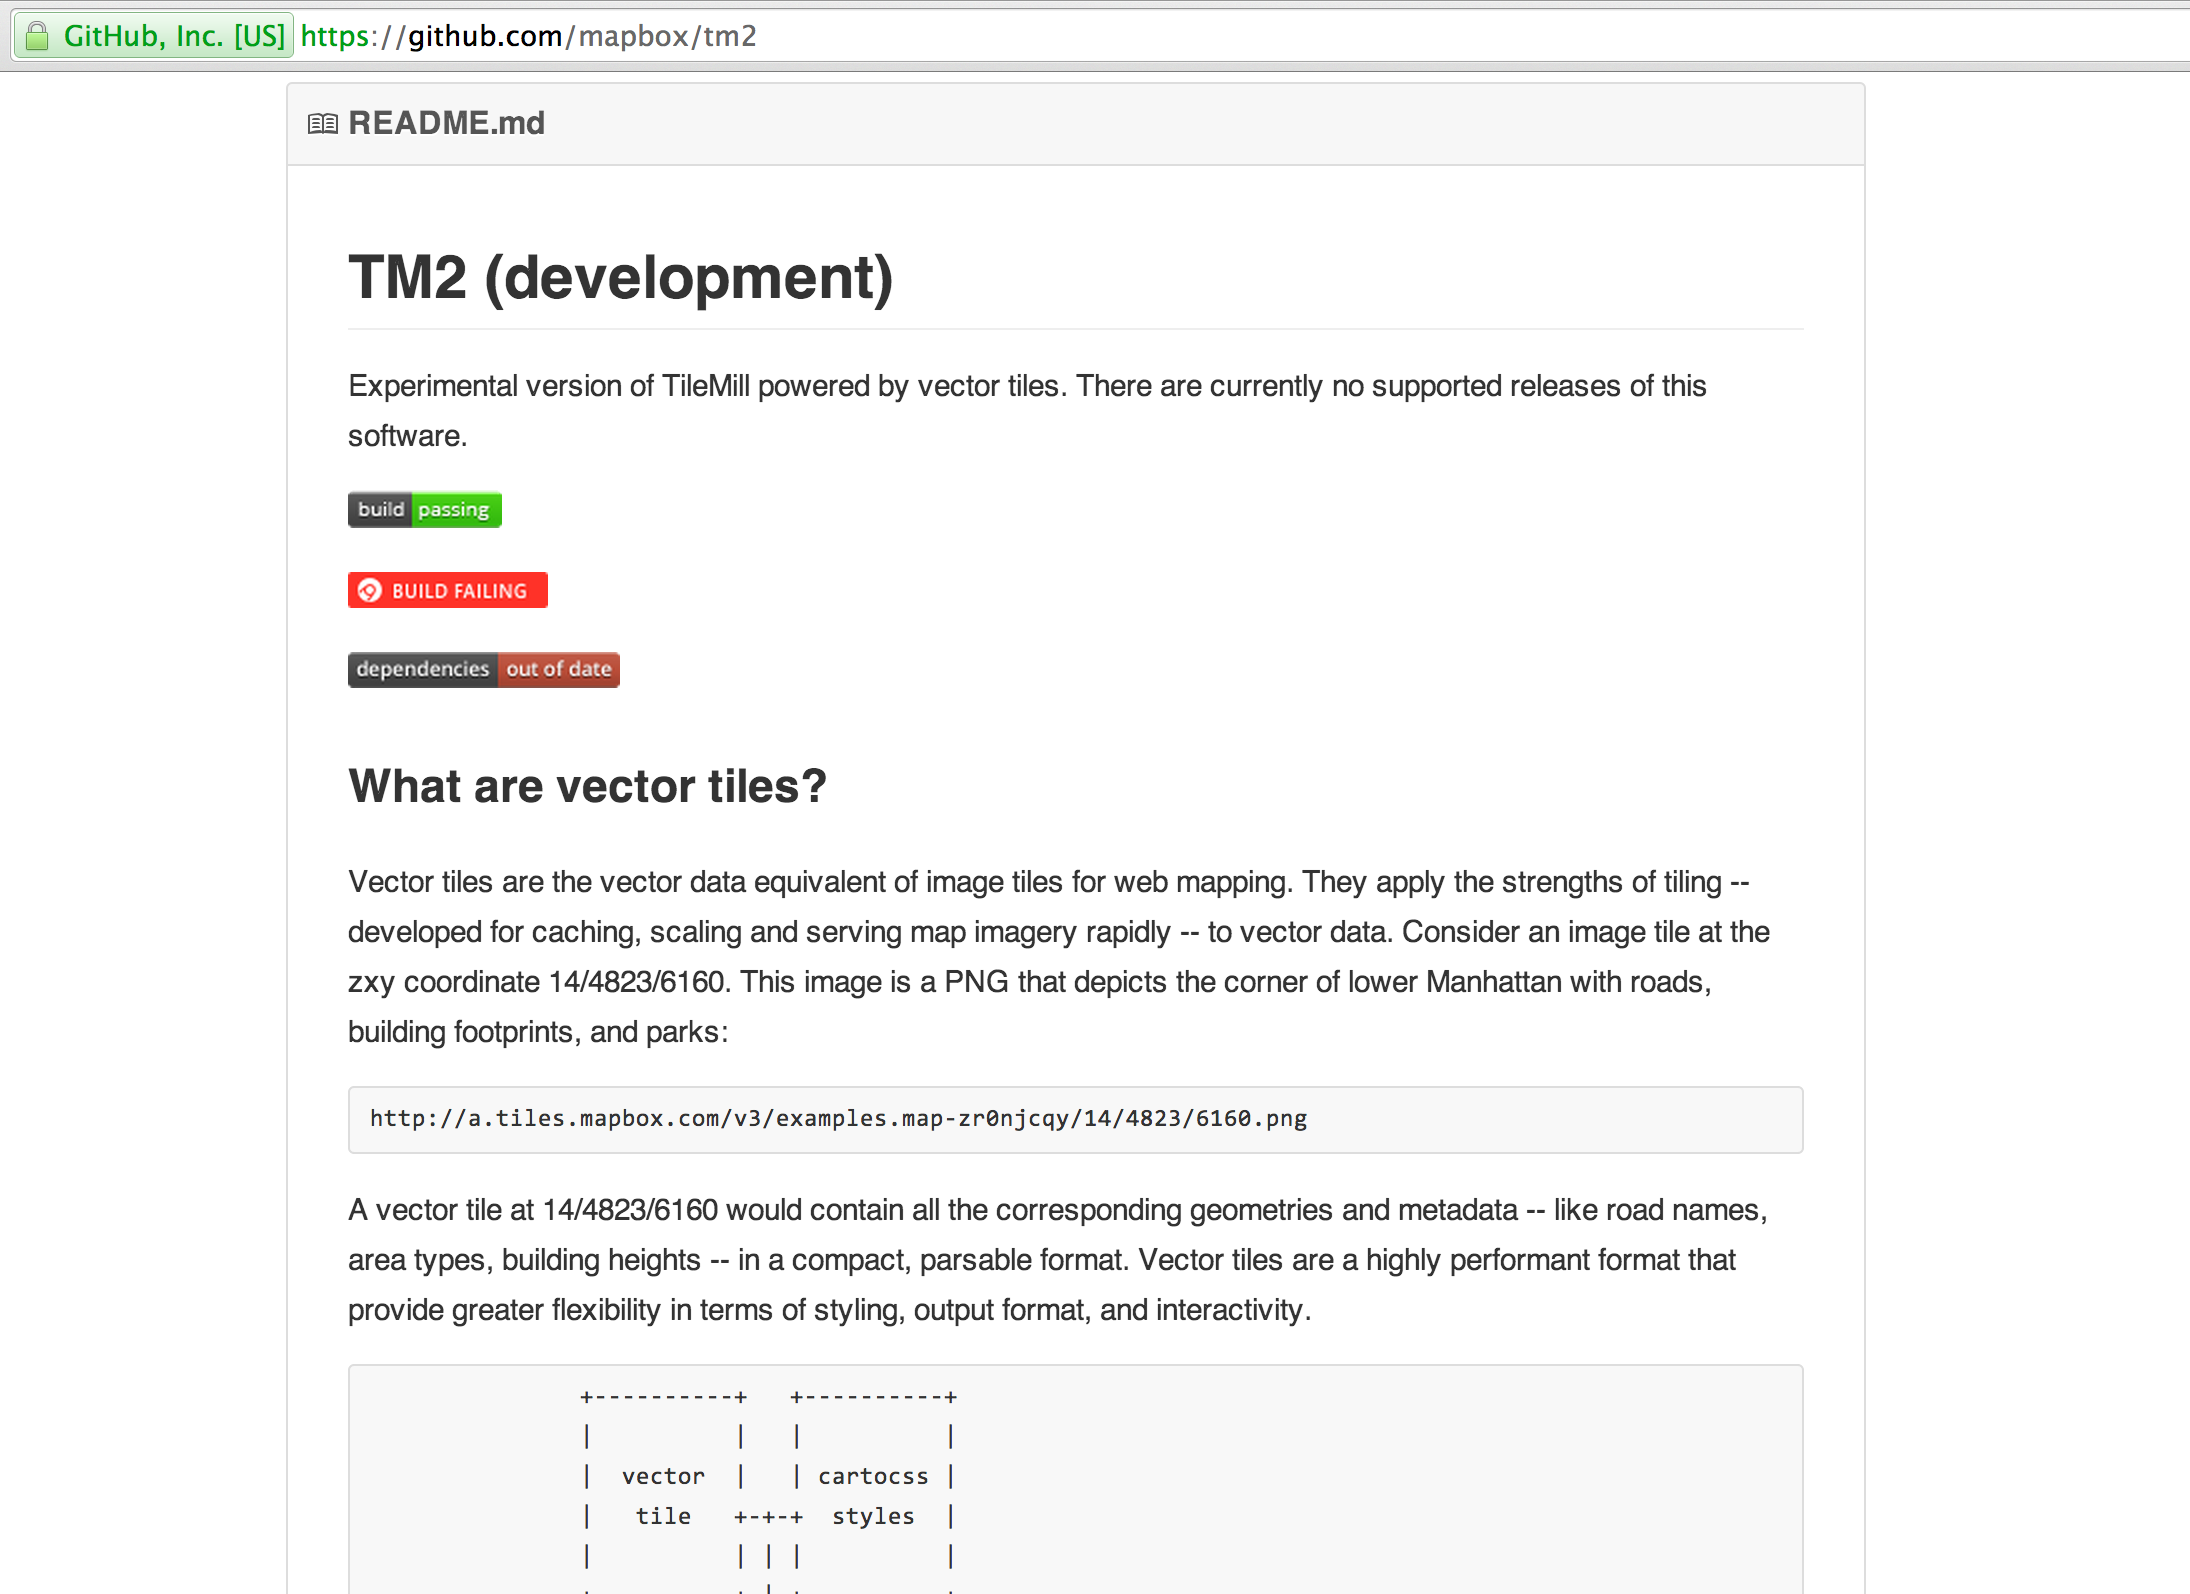
but why do I need an editor like tm2?
 the first web maps were pretty static
 the tile:
a 256 x 256 square of data
can be a raster (typically png) or vector
zoom 0:
zoom 1:
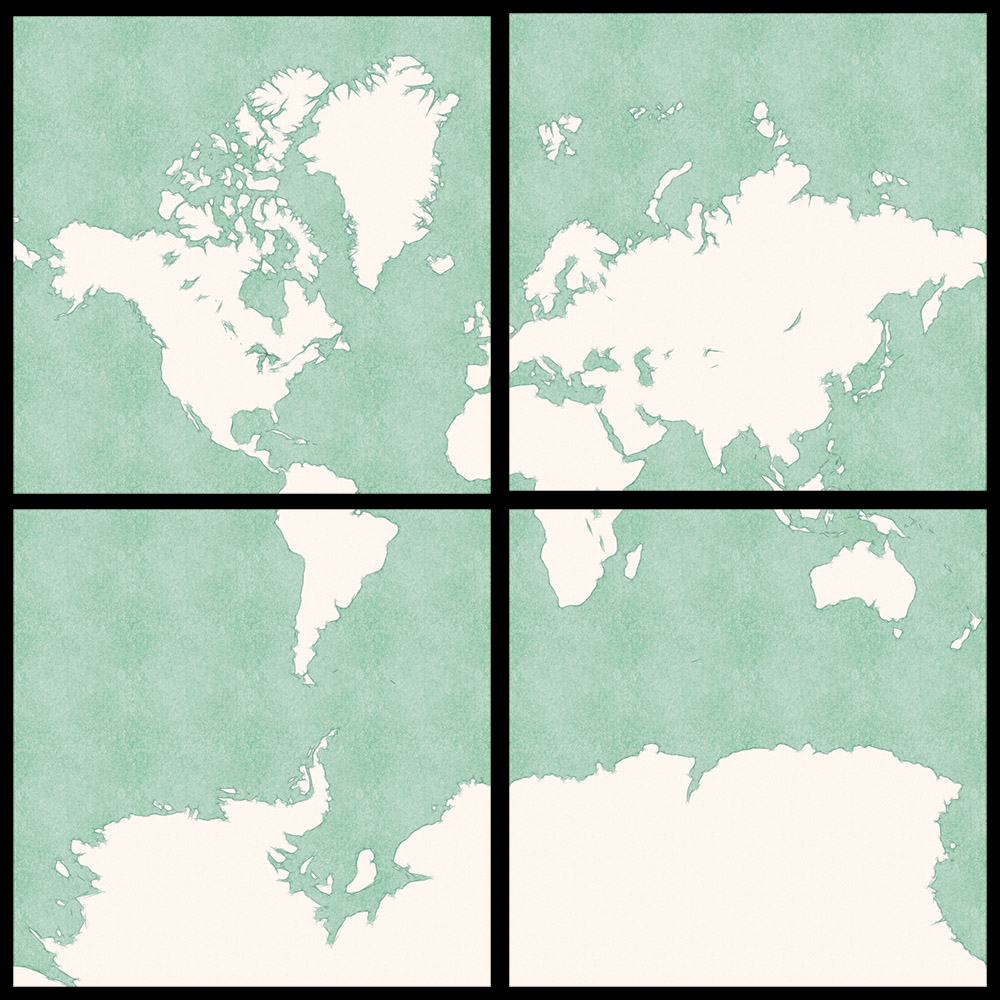
zoom 2: 16 tiles
zoom 3: 64 tiles
and so on to x^4
zoom 17 === 0.003 degrees
== 1.193 m /pixel === 1:4,000 scale
the tile coordinate system: z / x / y
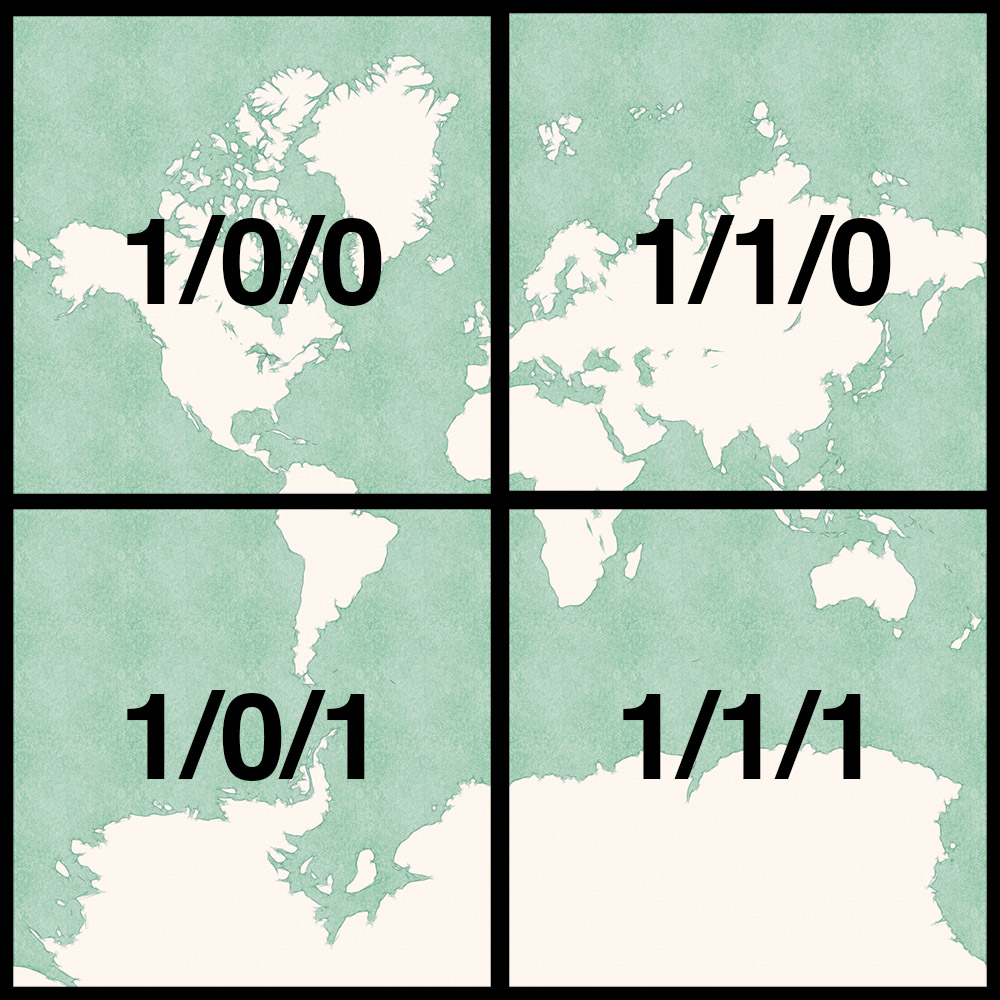
b.tiles.mapbox.com/v3/camilleanne.tm2-basemap/17/69450/38119.png
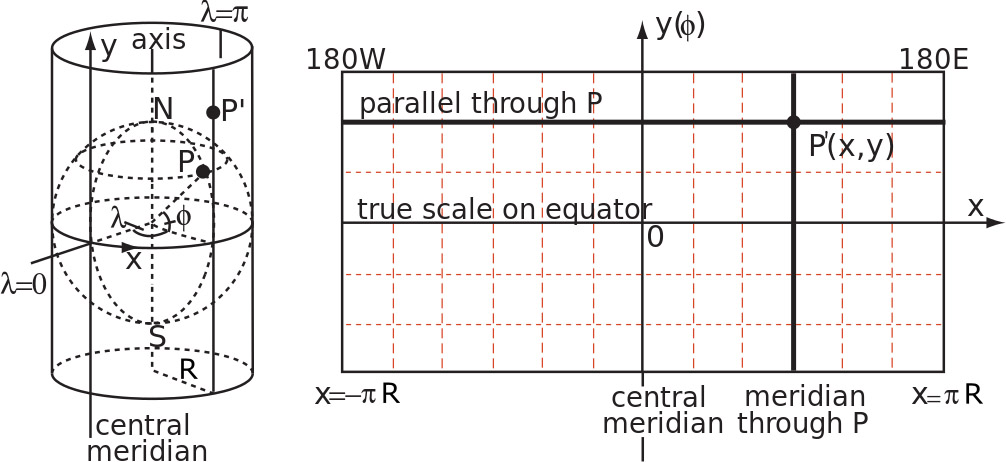
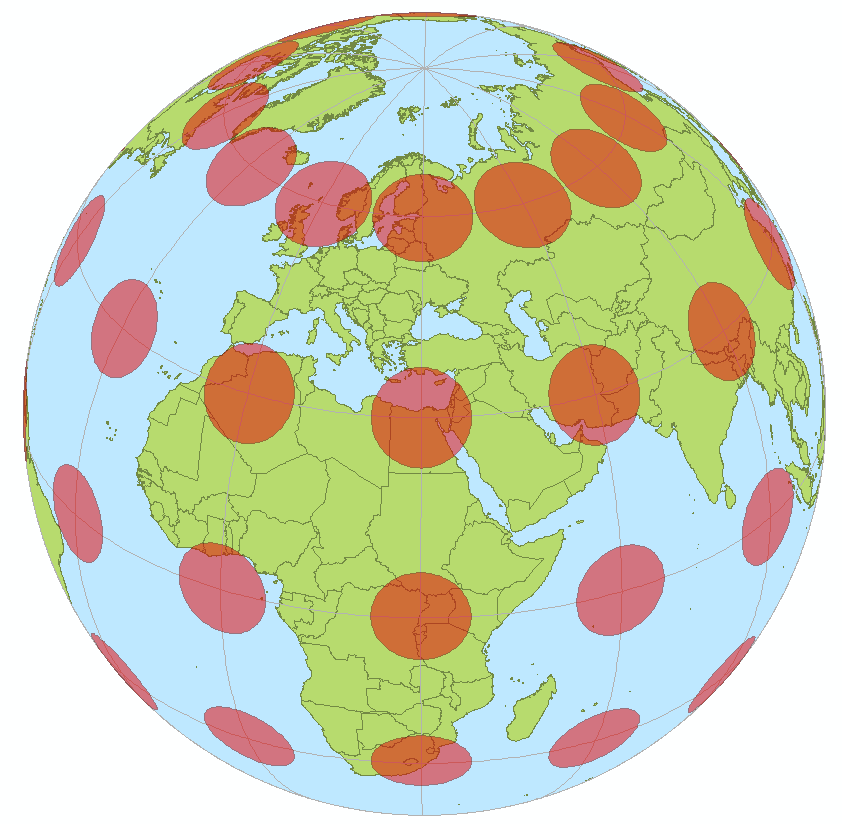 for this party trick of 3D globe --> 2D squares, we need some math
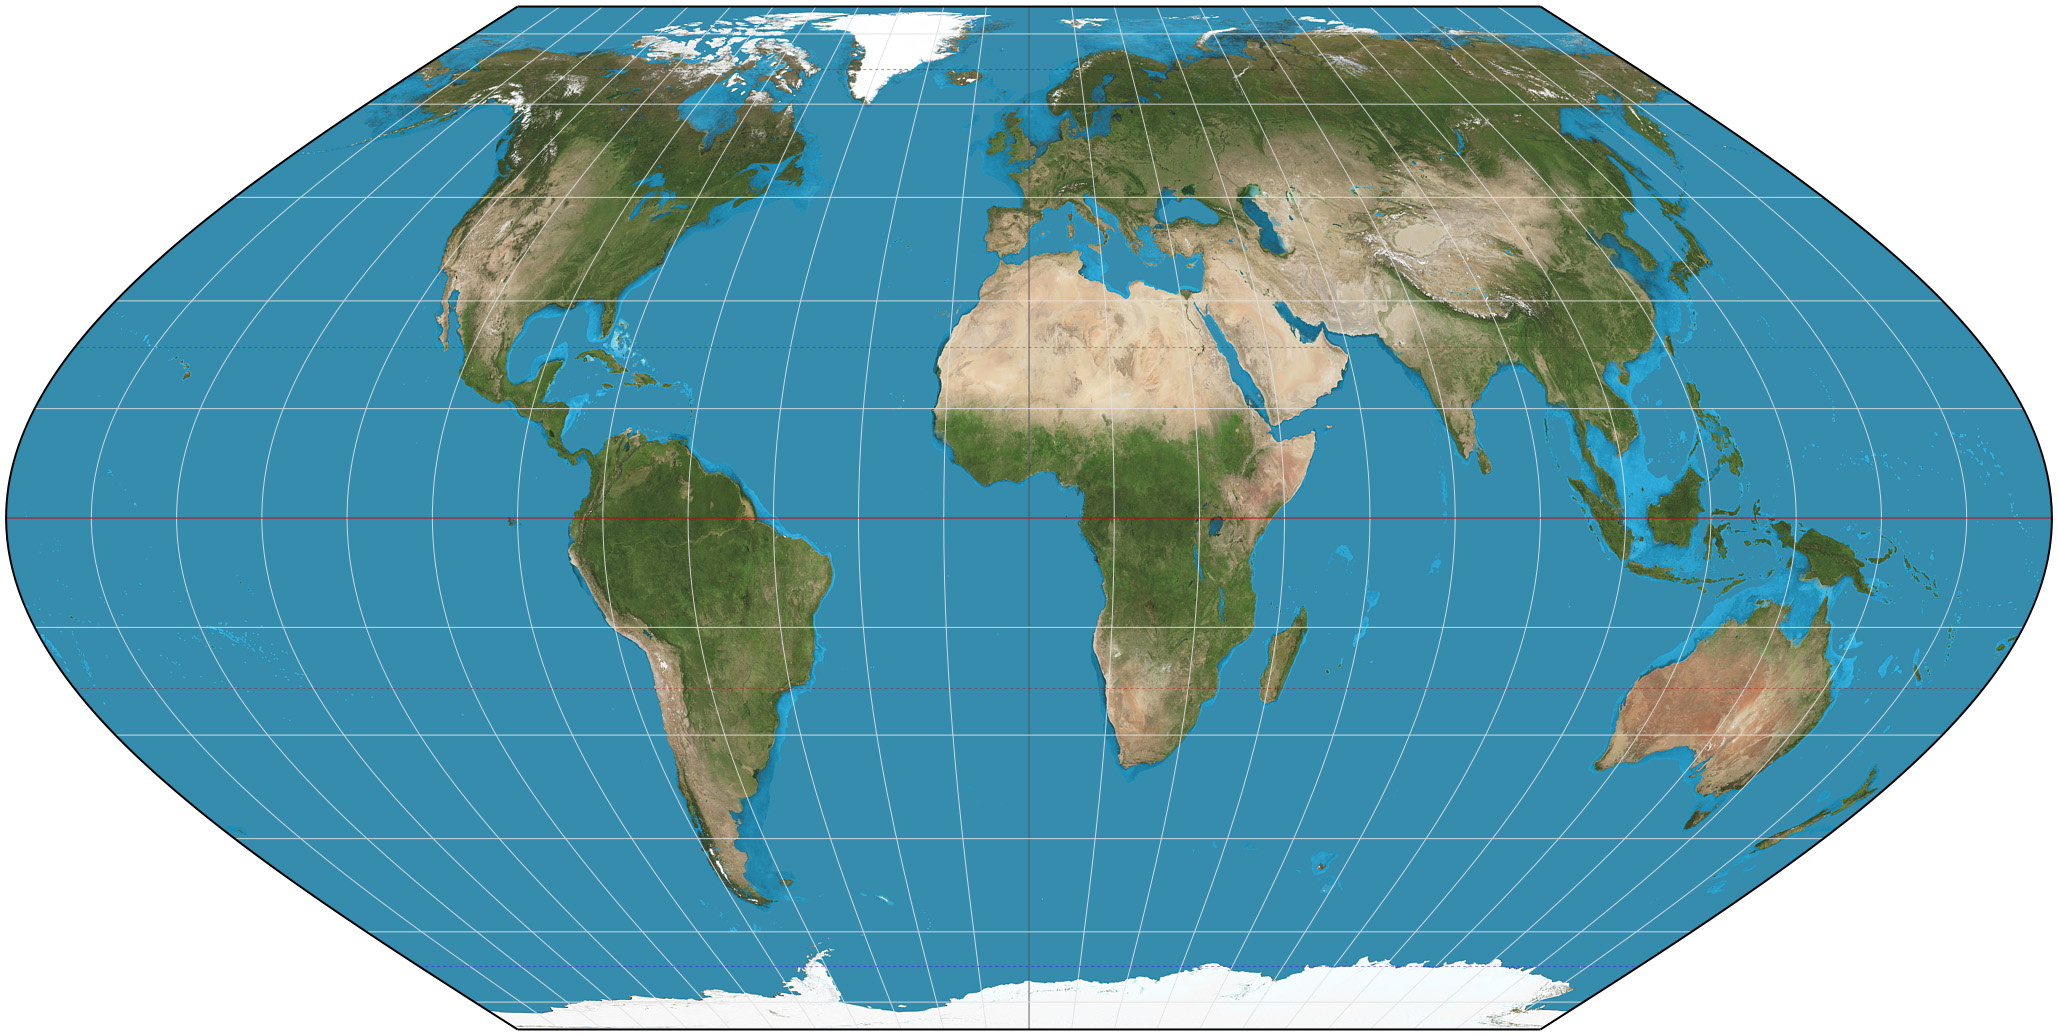
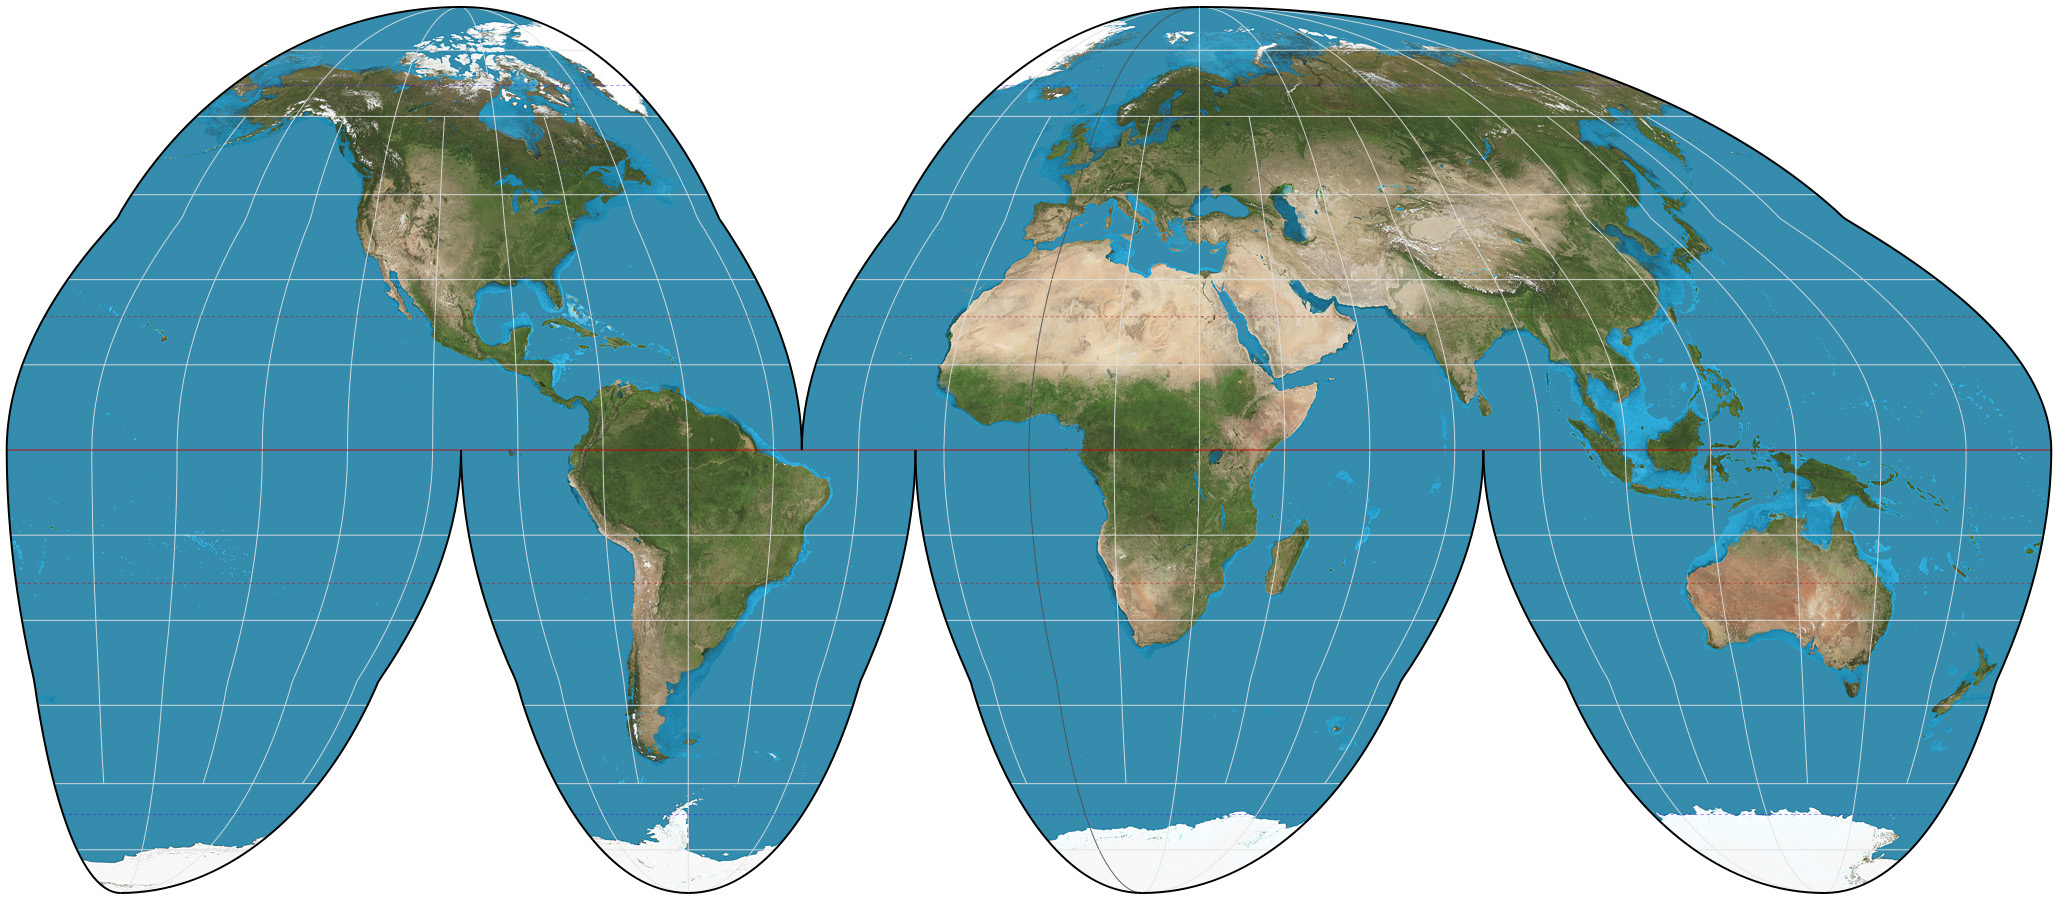
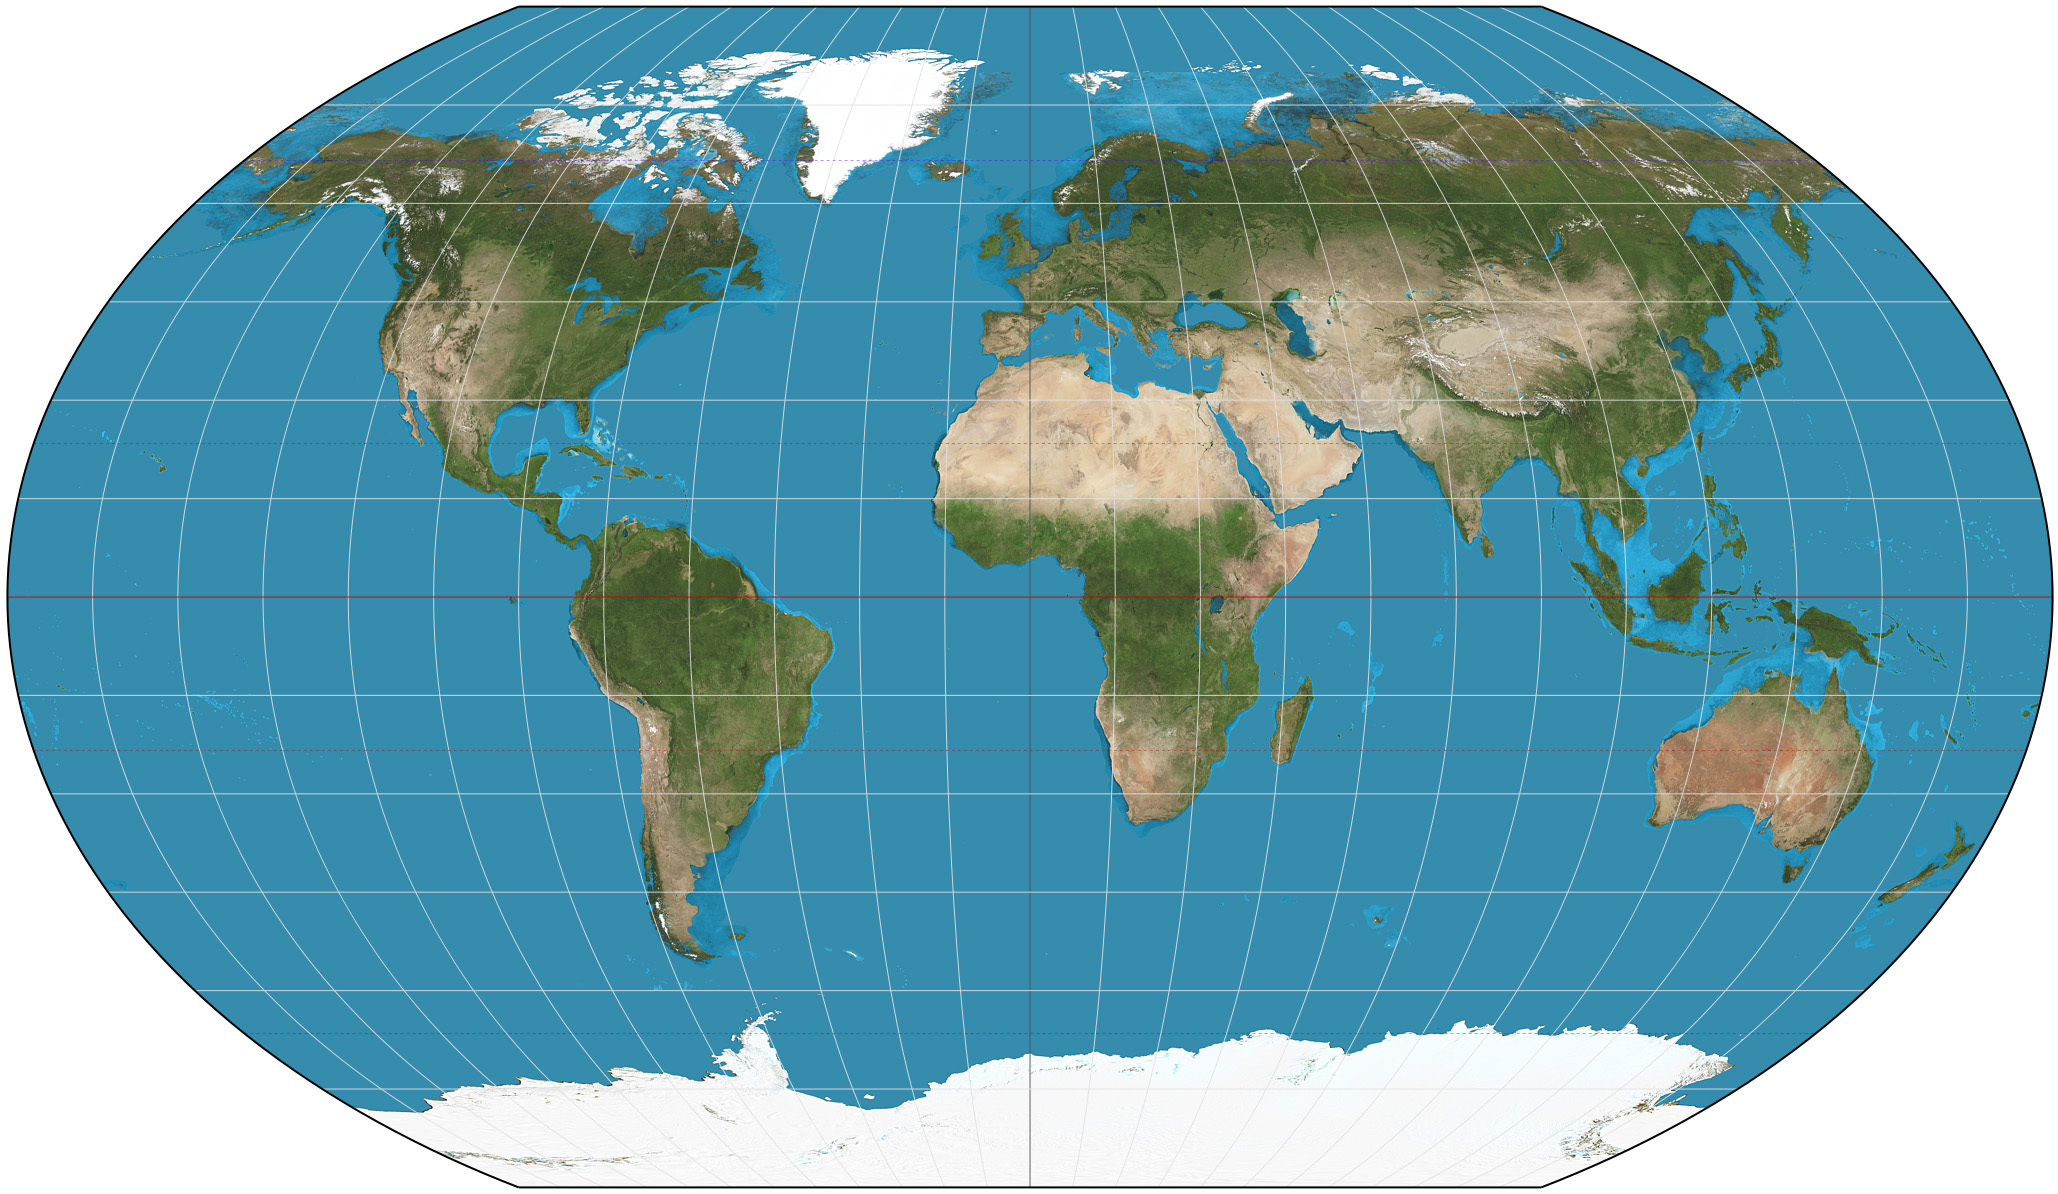
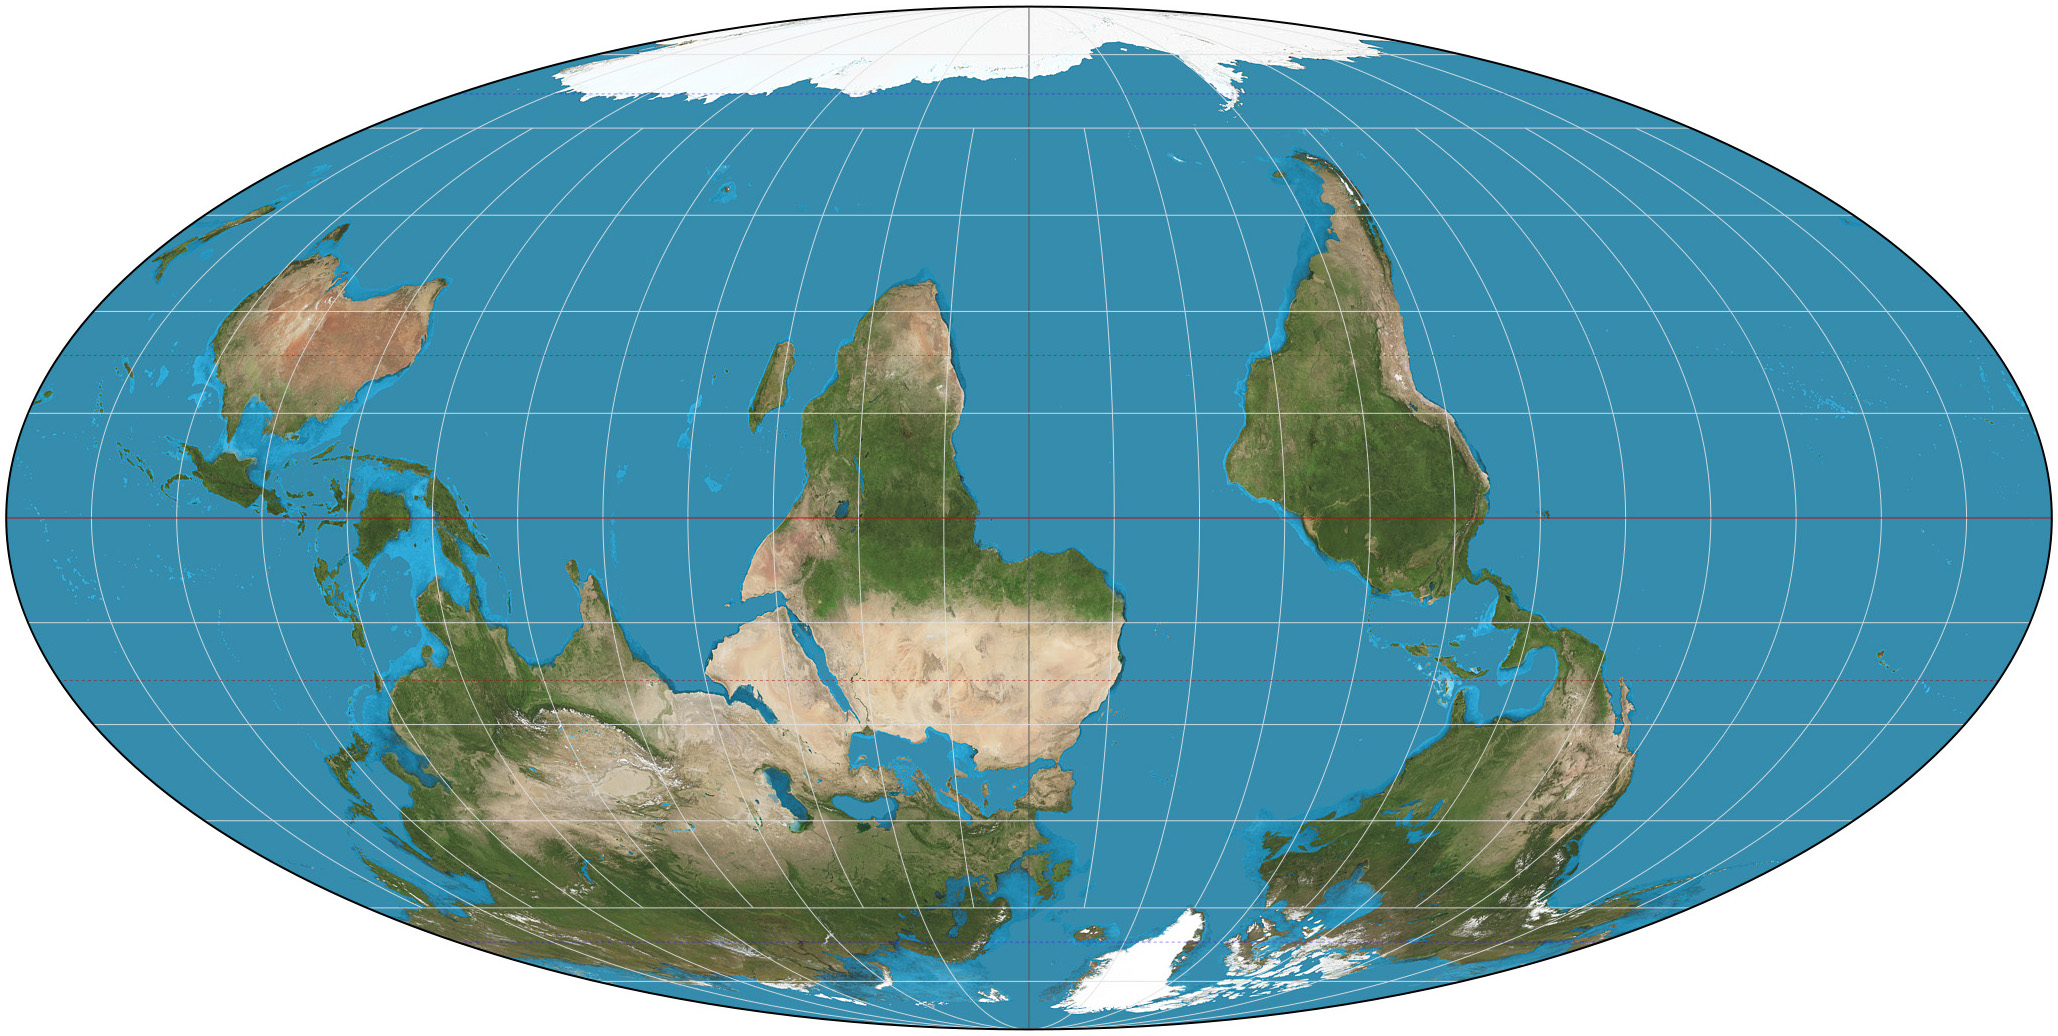
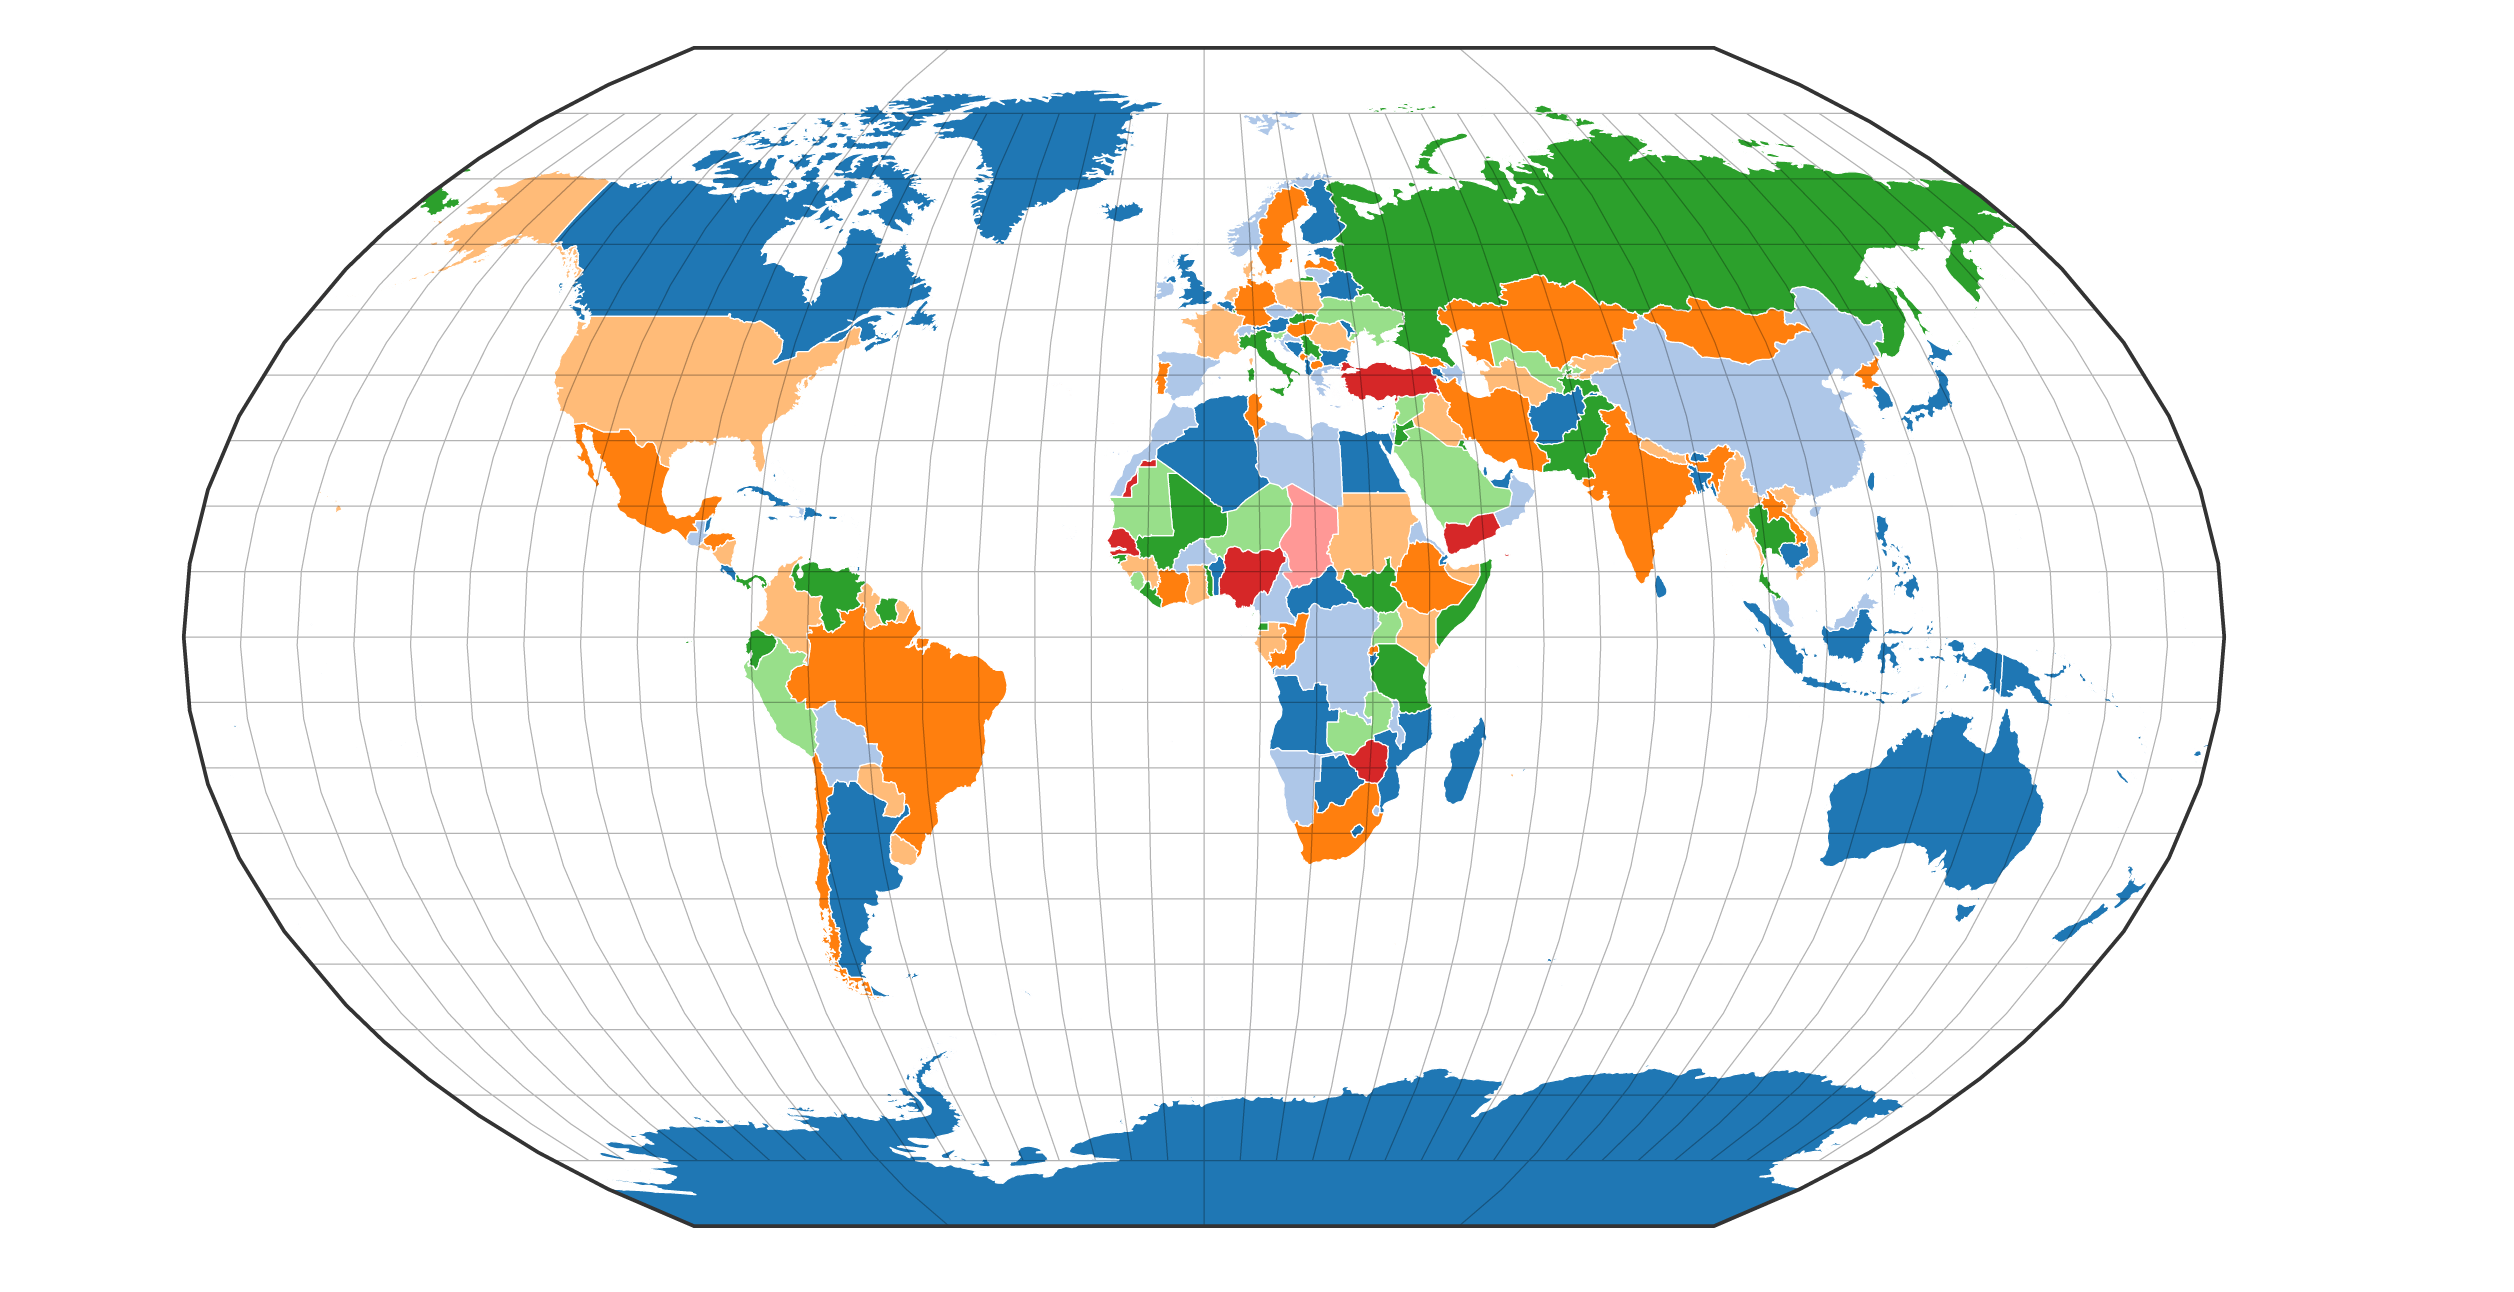
projections!
but don't get too excited, web maps all use the same projection
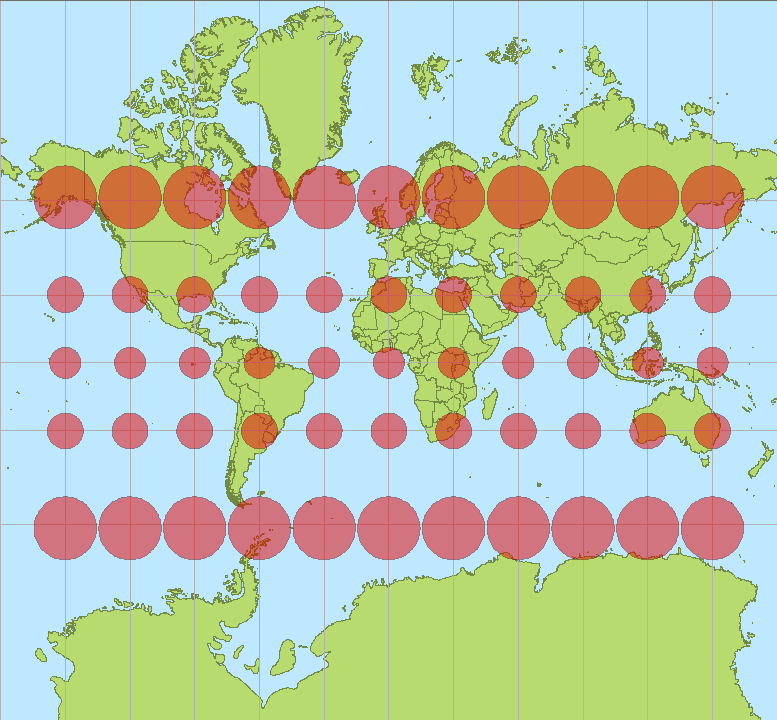
web mercator.
Web Mercator is the mapping of:
- WGS84 datum (i.e. ellipsoidal) latitude / longitude into Easting / Northing using spherical Mercator equations (where R = a)
- EPSG coordinate operation method code 1024 (Popular Visualization Pseudo Mercator, PVPM)
- EPSG CRS code 3857 WGS84/PVPM (CRS code 3785 is deprecated)
You don't need to remember any of that
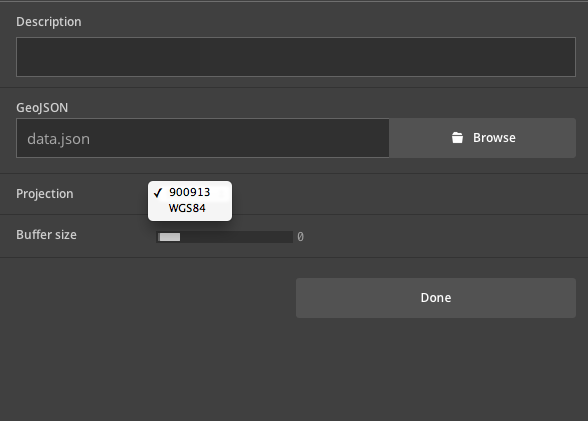
except maybe ESPG 3875 (aka 900913) + WGS84
but you'll rarely have to use them,
just know they exist and that you want to use ESPG 3875
Side note: there was a protocol WMS that could handle any projection. but it went the way of betamax
Also, a secret, you can make lots of things with tiles
psst-- want to play with projection? go play with d3
here and
hereback to tilemill.
Export your tiles
Mapbox will host them!
... if you must run your own tile server, I won't tell you how, but look at:
- Mapnik (and Node-Mapnik)
- TileCache
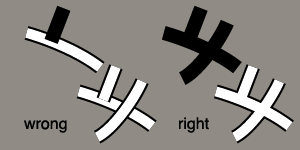
Mapnik -- the magic behind the tiles.
painter's algorithm:
but wait, if it's (x, y), isn't San Francisco at [-122.4376, 37.7577]?
of course, wrangling data is the hardest part
We really want everything to be geojson, right?
got shapefiles?
(e.g. a bucket of .shp, .prj, .shx, .dbf files?)
ogr2ogr has got your back
brew install gdal
ogr2ogr -f geoJSON muchBetter.json disaster.shp
got a bunch of KML or GPX data?
try togeojson
npm install -g togeojson
togeojson something.kml > somethingBetter.geojson
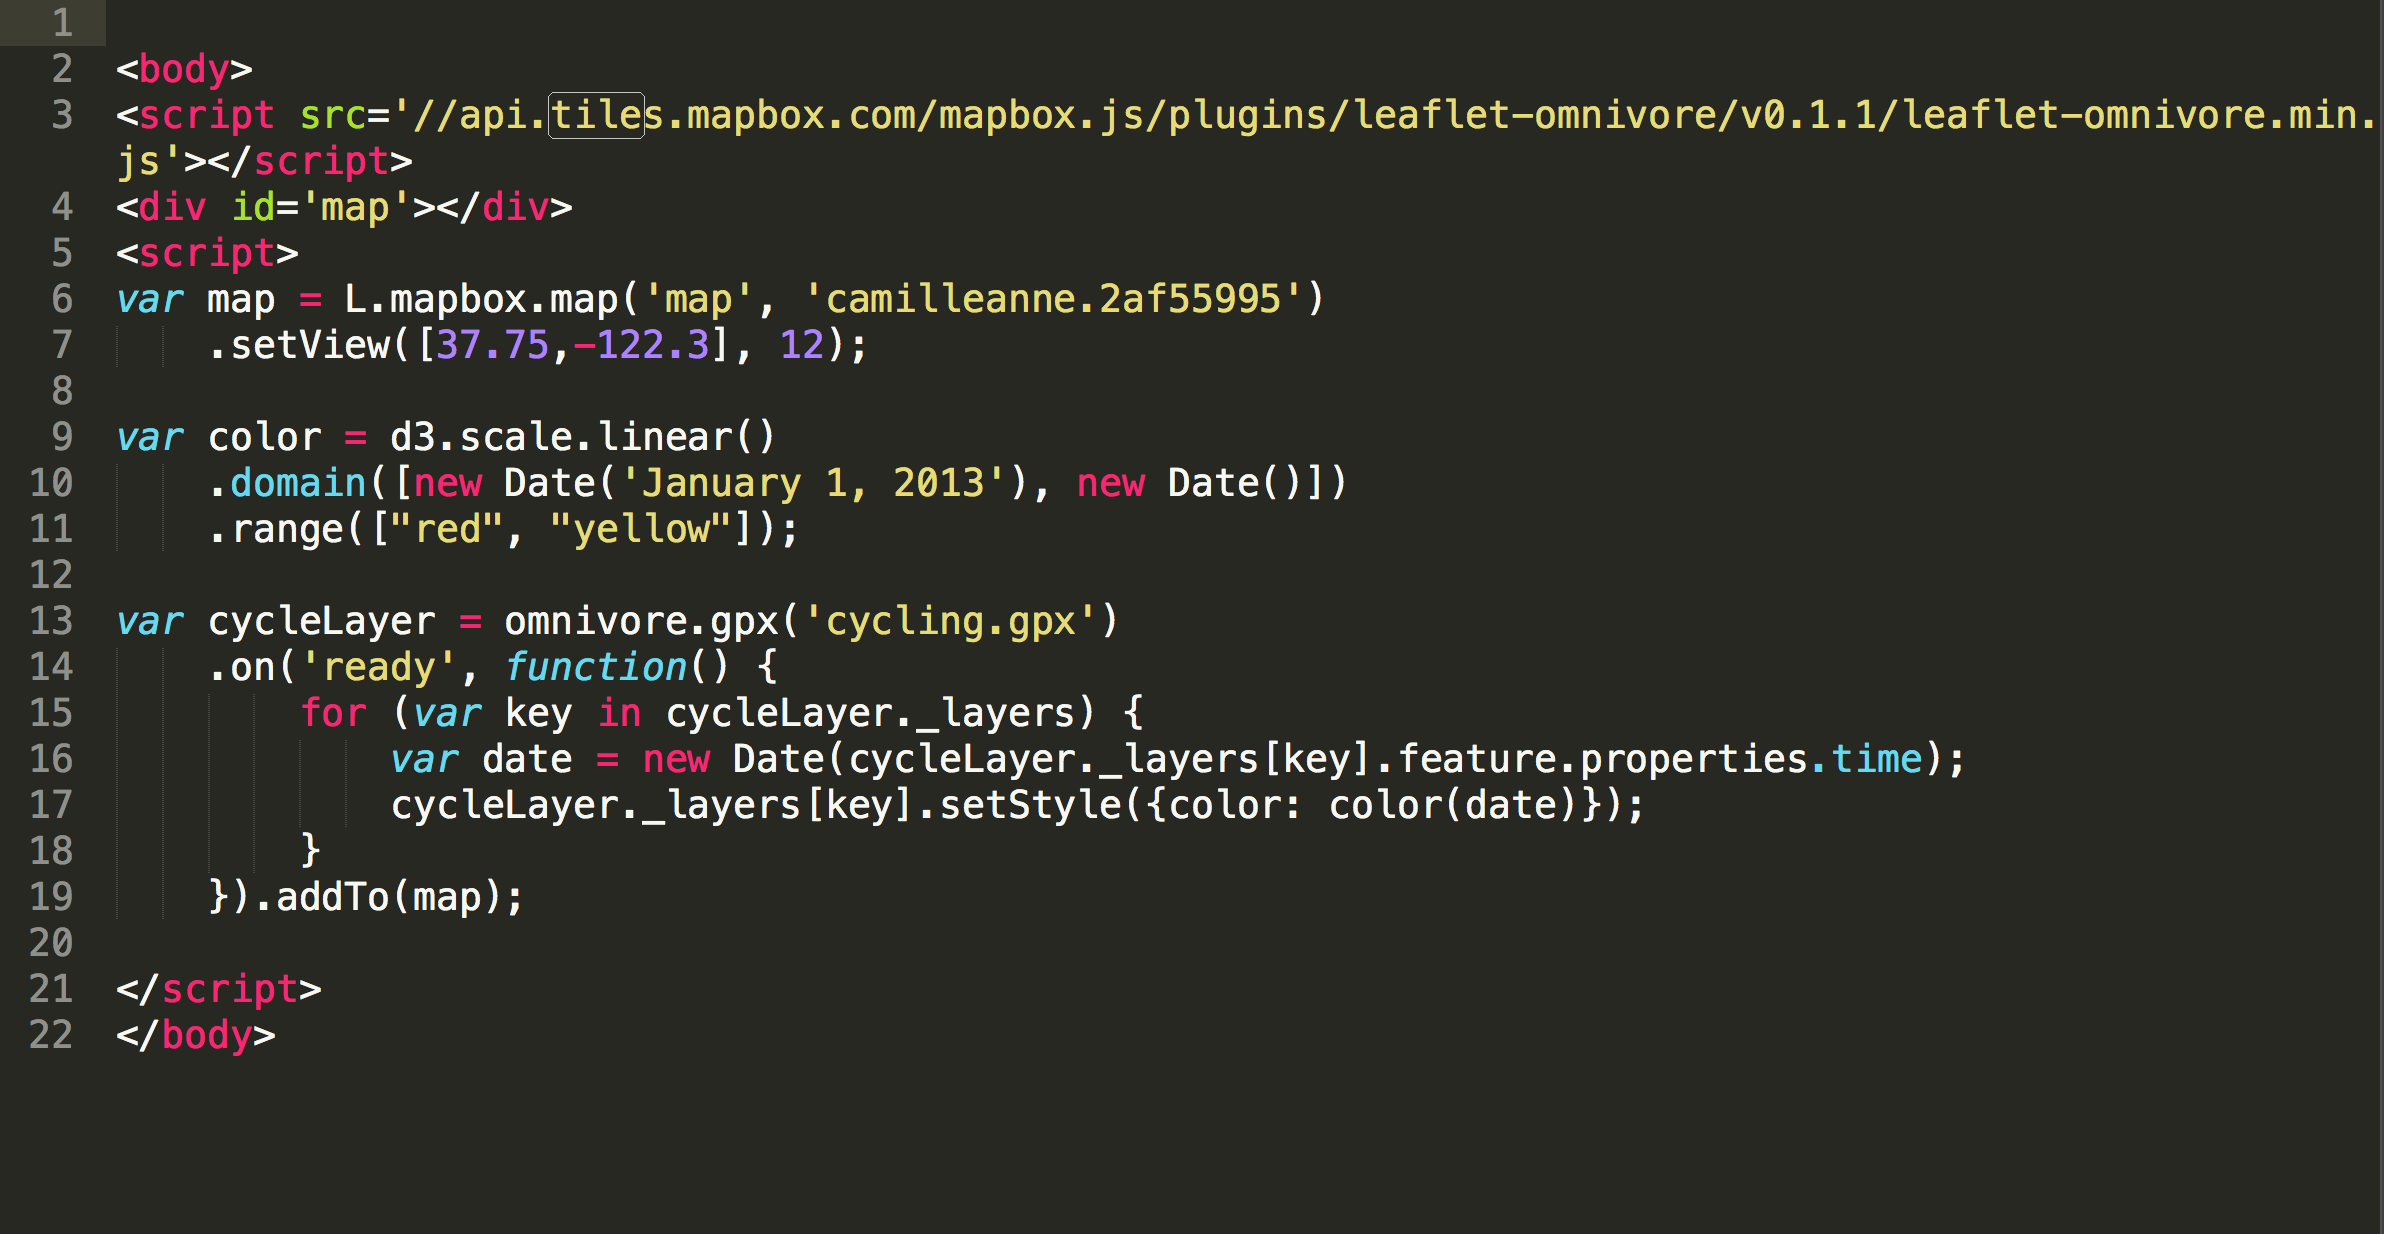
want to convert client side?
leaflet-omnivore
nom nom
var layer = omnivore.gpx('a.gpx').addTo(map);
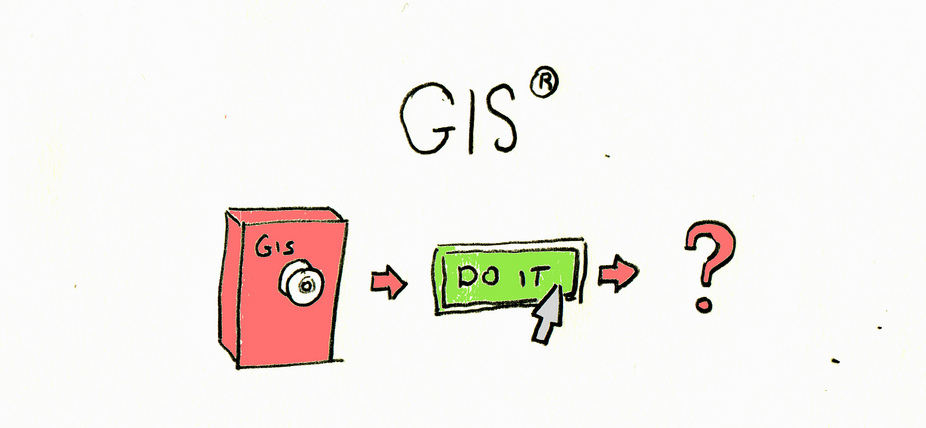
need more than conversion? need GIS software?
QGIS!